

6 Best App Intelligence Tools in 2026 (Free vs. Paid)
I’d pull up a few app intelligence tools if a rival puzzle game shot up the App Store charts a week before my launch.
My first question would be whether its downloads also rose in the US, where I plan to launch. Say the first tool gives me a worldwide estimate and the second shows a US ranking. Both give me a lead, but I still need US download estimates for the same store and time period before I change my launch plan.
I’ll compare six tools by what I can check for free and what’s worth paying for. I’ll also use Royal Match to show how market, store, and date filters affect the numbers I see.
Free and Paid App Intelligence Tools Compared
I’d start with Appark to find and monitor rivals, Appfigures for a recent worldwide estimate, or AppTweak for a first look at a specific country.
| Tool | Best fit | Access before paying | What to verify before buying |
|---|---|---|---|
| Appark | Finding rising apps and tracking rivals | Free plan with chart estimates, one month of history for download, revenue, and growth rankings, and monitoring for one app | Country filters, exports, and Starter access to download and revenue comparisons |
| Appfigures | Sizing up an app worldwide | Free snapshot of the latest month’s worldwide download and revenue estimates for covered apps | Country breakdowns, historical trends, and comparison limits |
| AppTweak Market Intelligence | Checking a target country | Free Starter plan with past-month download and revenue estimates | Longer history, exports, and access to app store optimization (ASO) tools |
| AppMagic | Finding comparable games by subgenre | Public charts and demo views with selected game data | Subgenre, country, and historical coverage for the games I need |
| Sensor Tower | Benchmarking downloads, revenue, and engagement | Free sign-up and demo | Which markets, metrics, and products the quote covers |
| Similarweb App Intelligence | Putting app usage and web traffic side by side | Sales demo to check data coverage | Usage coverage for my apps and the revenue add-on |
How I Compared the Tools
I compared the tools on market coverage, historical data, and what you can access before paying. Free plans, public charts, and sales demos offer different levels of access, so I’ve labeled each in the table.
I checked the access details on November 9, 2026, using vendor documentation and Appark’s confirmed Free plan terms. The Royal Match lookup uses screenshots from Appark Pro and AppMagic Demo captured that day.
What Each App Intelligence Tool Does Best
1. Appark for Competitor Discovery and Monitoring
I’d start with Appark to find apps in my category and track the closest competitors. The Downloads & Revenue Rankings show which apps already draw downloads or store spending. The Download & Revenue Growth Rankings help me find apps gaining ground that might be closer peers for a new product.
With the Free plan, I can do three things.
- Browse all chart types and see download and revenue estimates in the Downloads & Revenue Rankings.
- Access one month of Downloads & Revenue and Growth Rankings history, with limited filters.
- Compare ranking trends for up to three apps and monitor one app.
Free chart estimates and paid comparison metrics live in different views. Free includes ranking trends in App Comparison, while side-by-side downloads, store revenue, and revenue per download (RPD) require Starter or above. If I need to find peers by release date or app tags, I’d check the paid filters in Advanced Search. The Appark plan comparison shows which plans add more history and exports.
2. Appfigures for Worldwide Download and Revenue Estimates
Appfigures offers a free snapshot of estimated worldwide downloads and revenue for the latest month. I can open an app from the Top Apps lists or search for it after signing in.
Say I’m researching a habit tracker for the US. A large worldwide estimate tells me the rival has scale, but I still need to know how much of that activity comes from the US. For a launch decision, I’d check country coverage and a longer trend in the Appfigures Competitors report.
3. AppTweak Market Intelligence for Country-Level Estimates
If I’m launching a language-learning app in Canada, I’d use AppTweak to look for Canadian download and revenue estimates for the closest competitors on my target store.
AppTweak lists past-month download and revenue estimates on its free Market Intelligence Starter plan. It advertises coverage across more than 100 countries, so I’d check whether my specific app, market, and store have the data I need.
AppTweak also sells app store optimization (ASO) tools for researching store keywords and visibility. I’d check which plan covers the historical download estimates I need and which covers keyword research, especially if I’m budgeting for both jobs.
4. AppMagic for Mobile Game Subgenre Research
A broad category like Puzzle can put block puzzles, merge games, and match-three titles in the same list. AppMagic’s game tags and subgenres help me narrow that list to titles a player might actually choose over mine.
I’d start with a public chart, then narrow the list to games with similar mechanics and launch dates. For a paid plan, I’d ask whether I can follow that group in my target country over the full period I need.
Sensor Tower acquired AppMagic in May 2026. I’ve kept them separate here because AppMagic remains a distinct offering with a game research workflow.
5. Sensor Tower for App Engagement Benchmarks
Sensor Tower’s App Performance Insights combines download and revenue estimates with usage metrics such as active users and retention. I’d use those metrics to see whether a competitor’s download surge came with sustained usage.
For a demo, I’d bring one large competitor and one smaller app that resembles mine. I’d ask to see both across the same two markets and date range. I’d then check whether the quote includes the markets, usage metrics, and history my team saw in the demo.
6. Similarweb App Intelligence for App Usage and Web Traffic
For a travel brand, I might use Similarweb to see whether web traffic and app sessions peak at different points in booking season. Those trends show how the two channels move, while individual customer journeys require separate data.
Similarweb’s App Intelligence package covers store performance and usage metrics such as sessions and retention. App revenue is an add-on, so I’d confirm that it’s included if revenue estimates are part of the job.
What Appark and AppMagic Show for Royal Match
One Game, Two Reporting Scopes
I used two app intelligence tools to look up Royal Match, a puzzle game by Dream Games. I matched the iOS listing by its App Store ID, 1482155847.
| View observed on November 9, 2026 | Market and store scope | Reporting period | Estimated downloads shown | Estimated revenue shown |
|---|---|---|---|---|
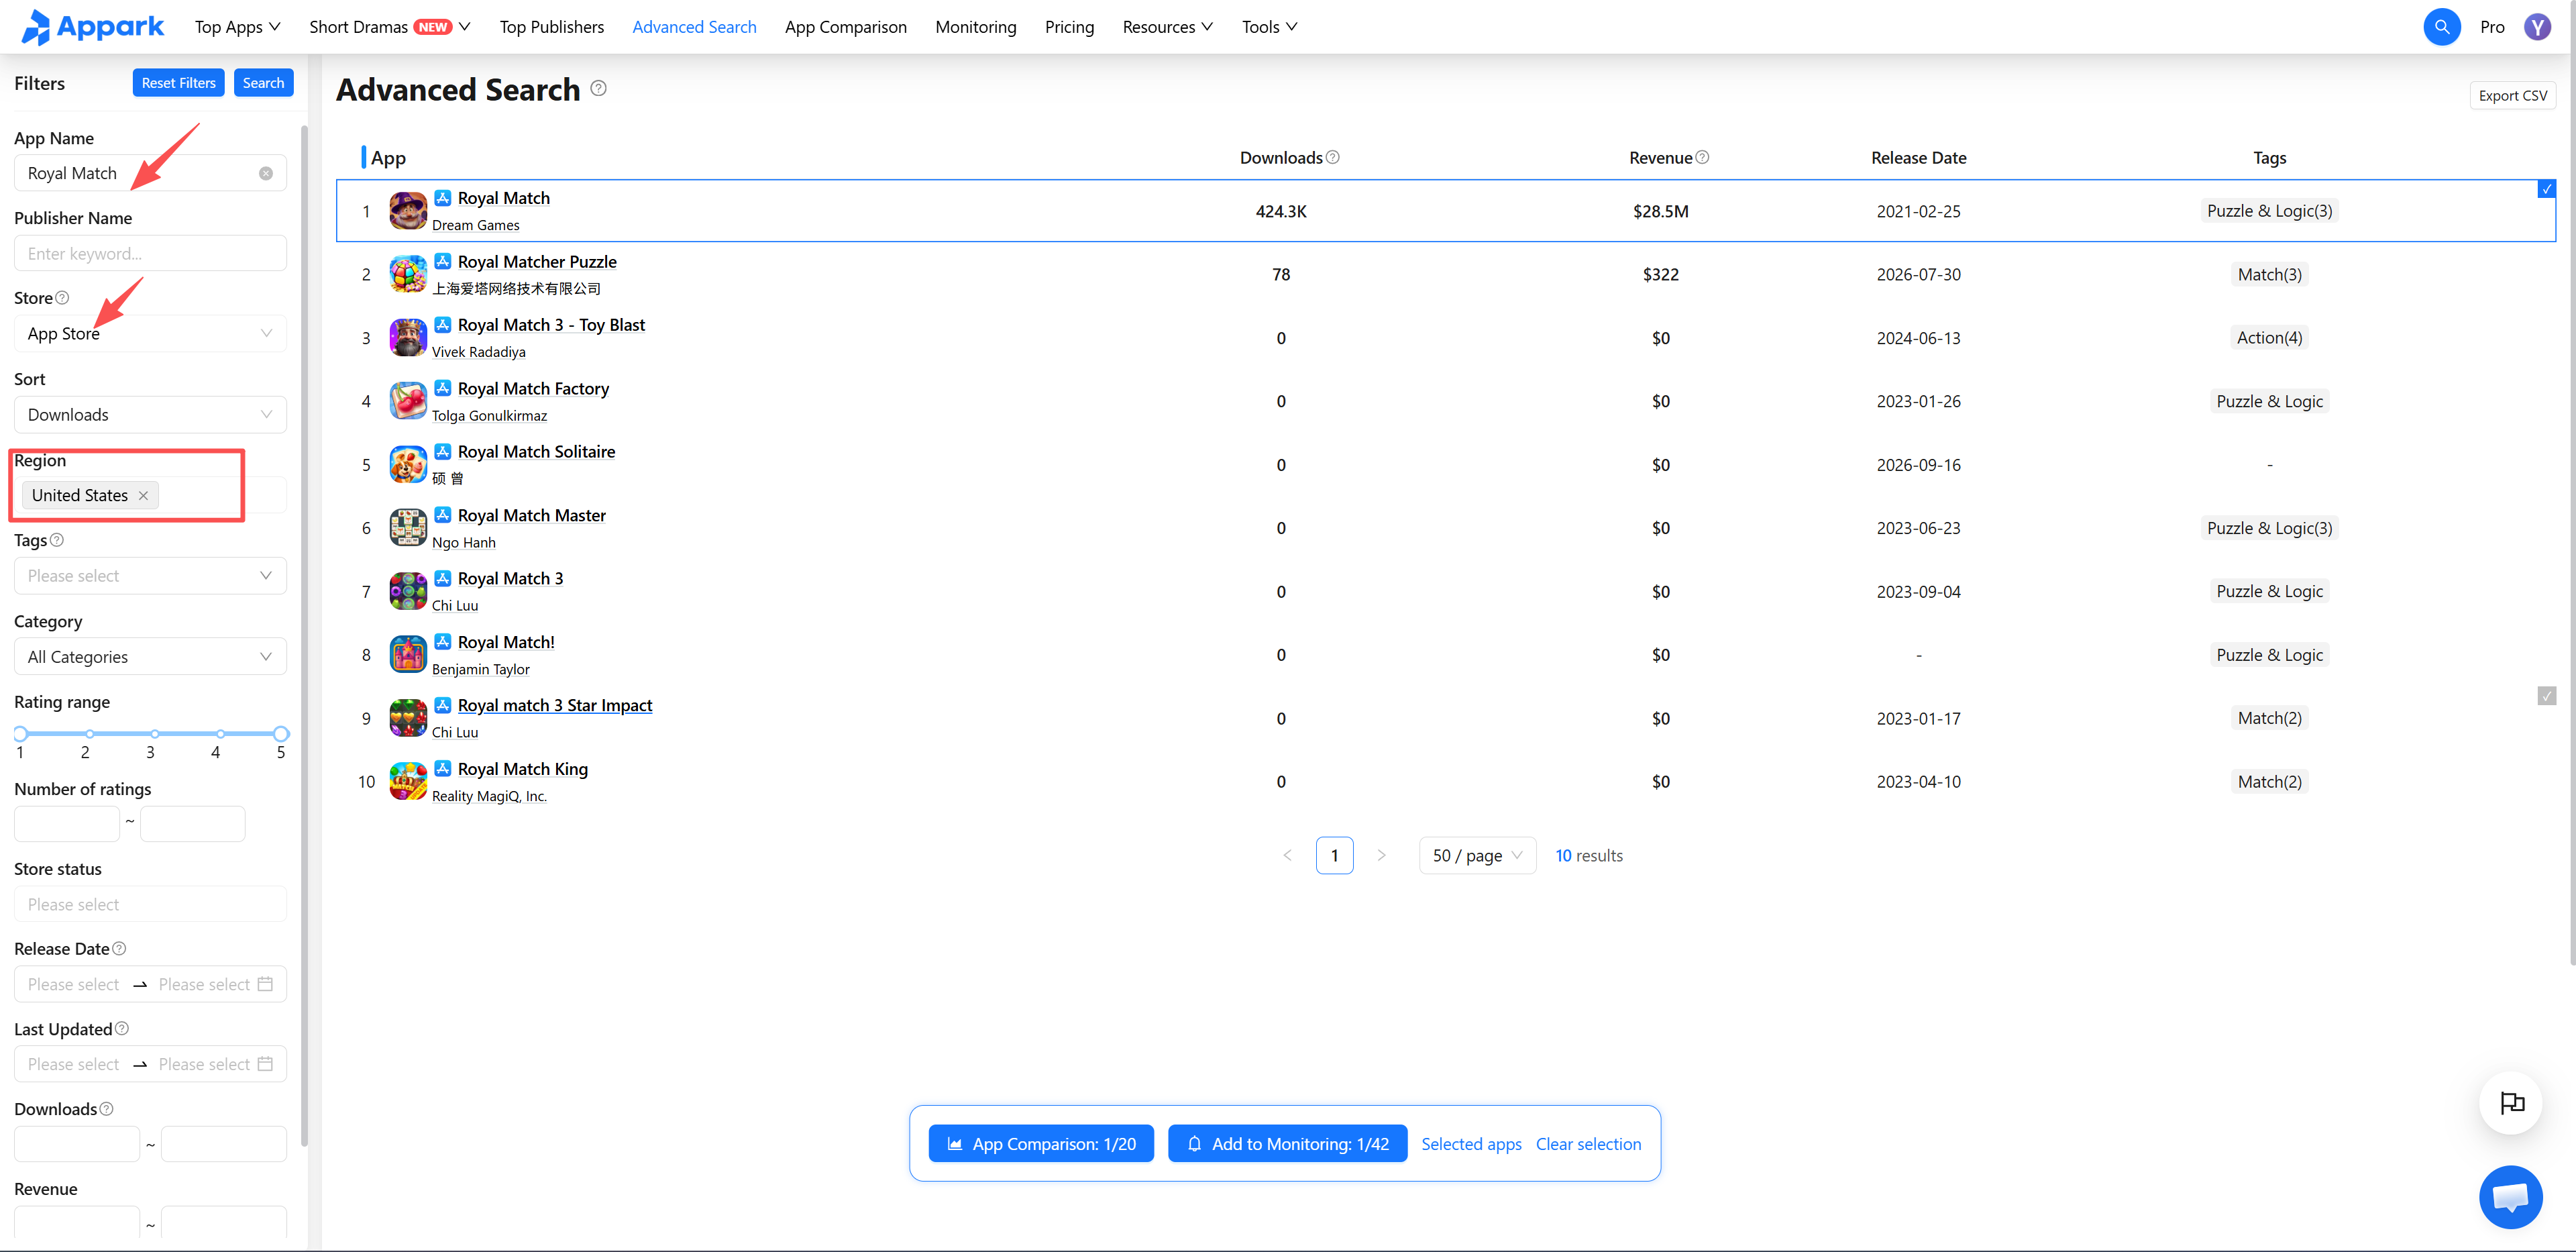
| Appark Pro · Advanced Search | United States · Apple App Store | October 1–31, 2026 | 424.3K | $28.5M in store revenue |
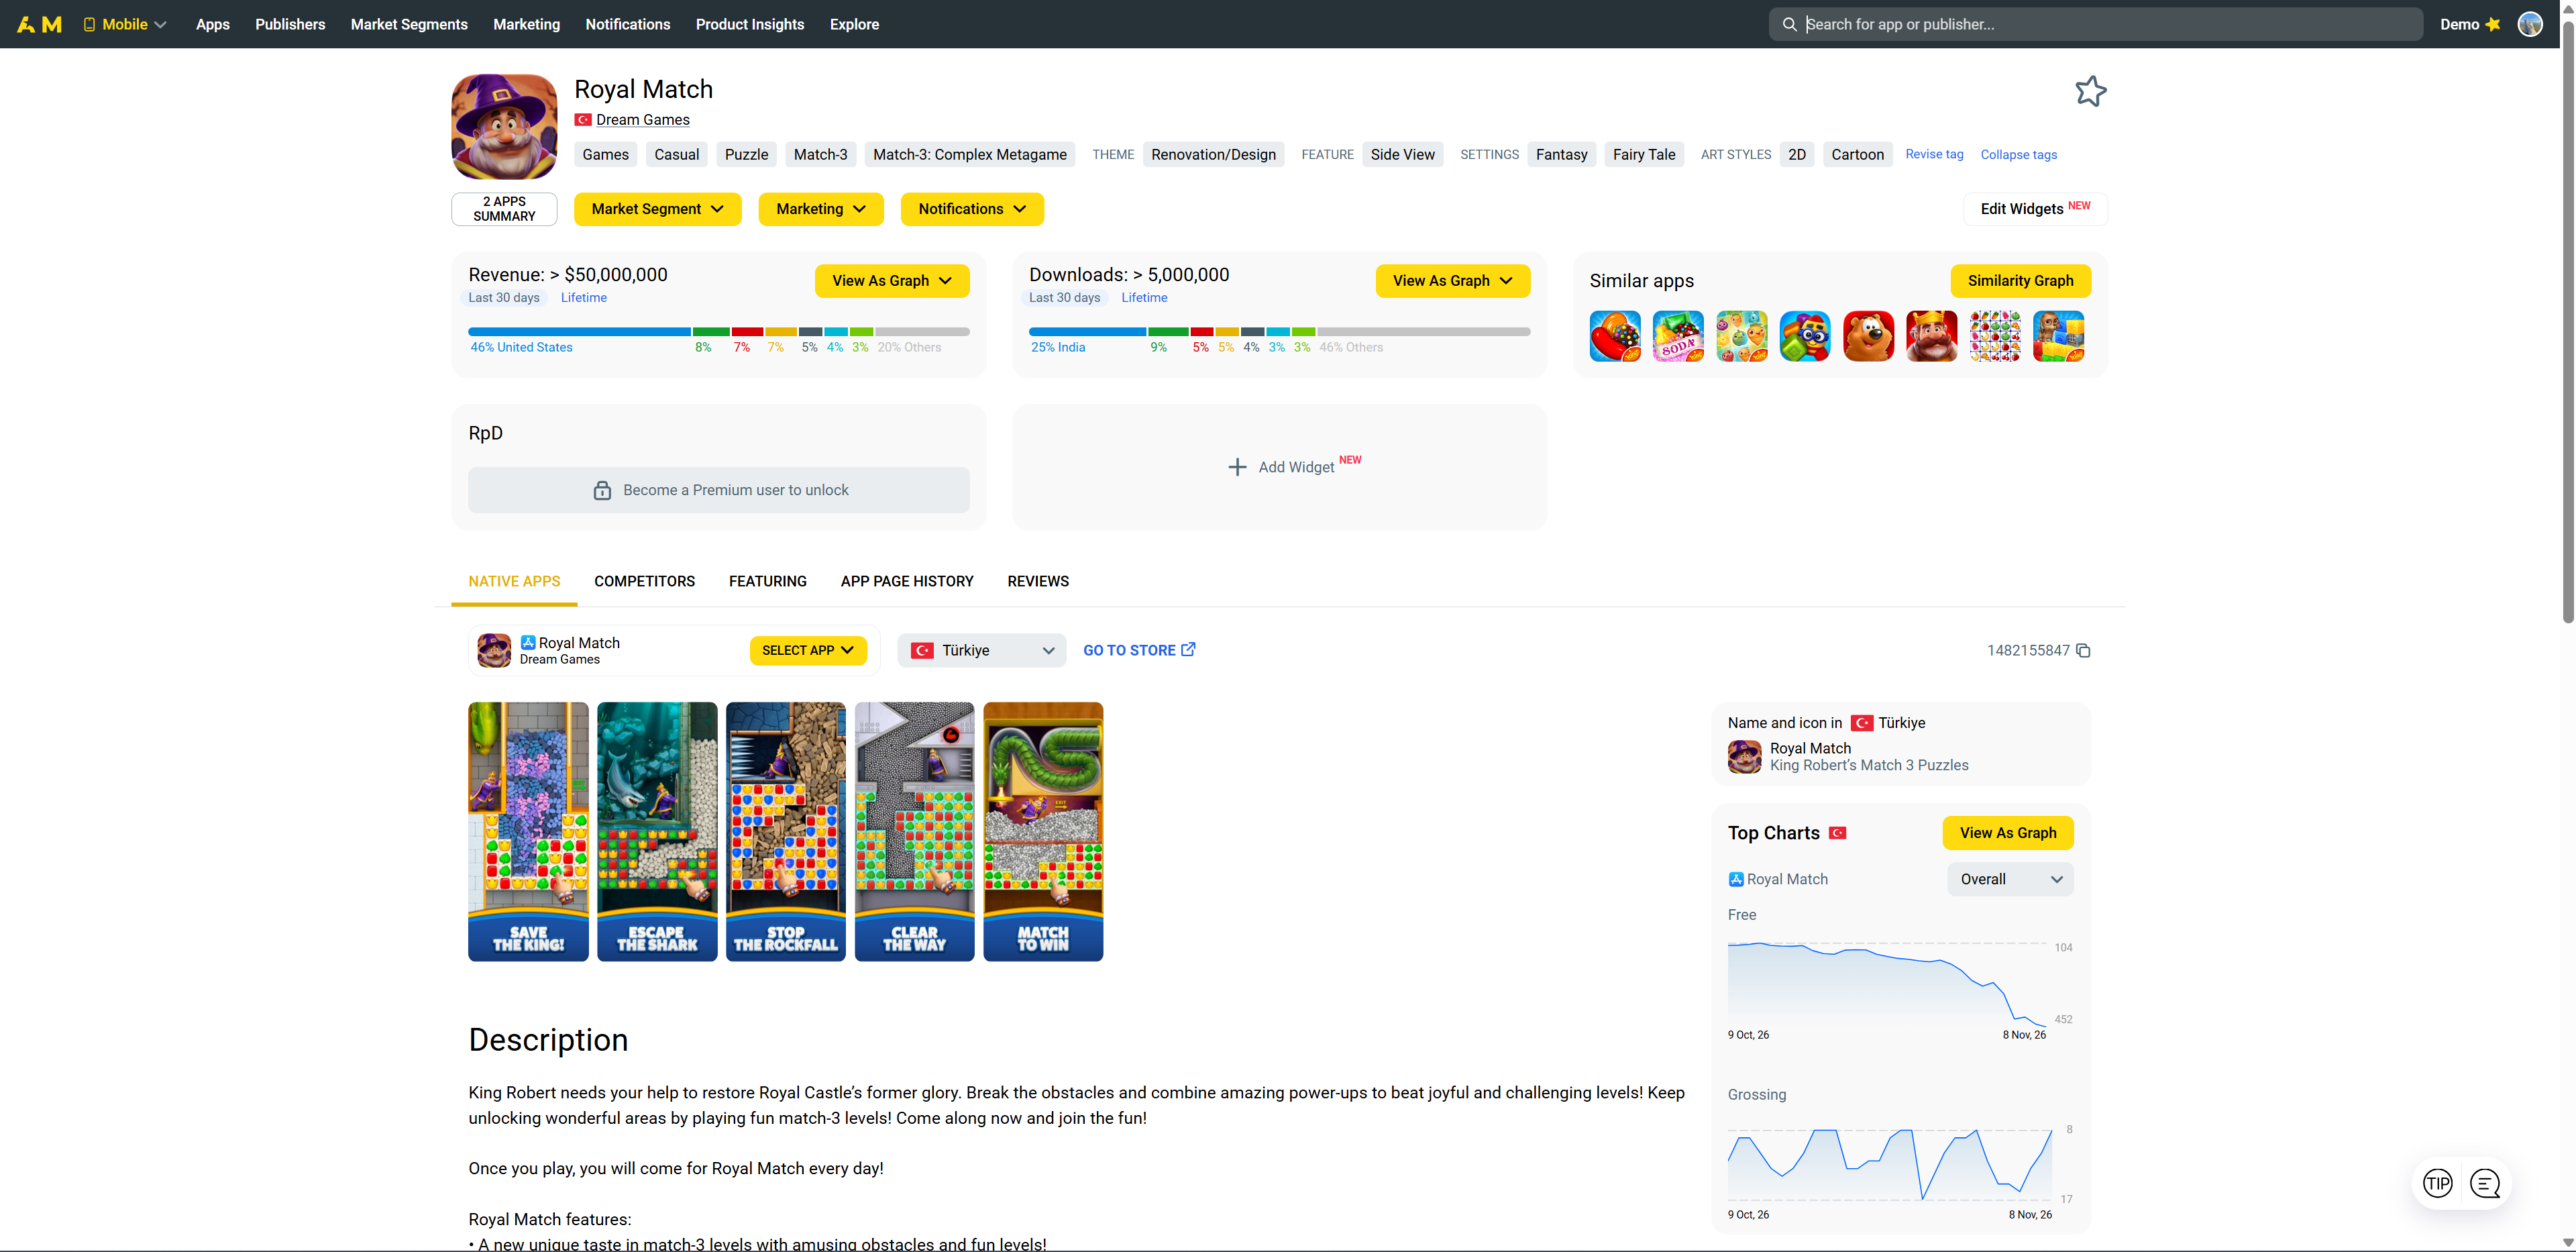
| AppMagic Demo · Royal Match summary | Worldwide · App Store and Google Play | Last 30 days on both cards | Over 5M | Over $50M |
In Appark Advanced Search, I selected the United States and the App Store. The view reports the previous complete calendar month, so the November lookup covers October 1–31.
In AppMagic Demo, I set both summary cards to Last 30 days. The cards display thresholds for the two-app summary and show a breakdown by country. The country and store filters were locked in the Advanced Search demo view I checked.
How I’d Compare the Estimates
For a US iOS launch decision, I’d use the Appark result to gauge the scale of Royal Match in that market. I’d use the AppMagic summary to gauge worldwide scale. To compare providers’ estimates directly, I’d look for the same US App Store listing and October date range, then check that both tools define downloads and revenue the same way.
How to Interpret App Download and Revenue Estimates
Downloads, Installs, and App Store Rankings
Before comparing download estimates, I check what each tool counts. Apple’s App Store Connect separates first-time downloads from redownloads, while Google Play Console reports acquisitions by user or by device. If I’m comparing an estimate with first-party data for my own app, I match the vendor’s definition to the store’s metric first.
Rank tells me where an app sits on a chart like Top Free or Top Grossing. Estimated downloads tell me roughly how many times it was downloaded in a given market and period. If a rival moves from No. 40 to No. 20, I check its download trend to see whether its own volume rose.
Store Revenue, Gross Spending, and Net Revenue
Under Appark’s revenue methodology, estimated store revenue covers paid downloads, in-app purchases, and subscriptions billed through the store. The estimate excludes advertising, e-commerce, and payments made outside the app stores.
Before comparing revenue figures, I check whether each tool reports gross consumer spending or net developer revenue after fees and other adjustments. The Appfigures estimates API for example, reports net revenue.
For a free puzzle game that relies on ads, store revenue can miss a meaningful share of the business. I’d use downloads and rank to gauge demand, then look for separate evidence of ad revenue.
Why Two Tools Can Show Different Estimates
Tools can model competitor downloads and revenue differently. When two estimates disagree, I’d check these three things before using either one.
- Match the scope. Check the app listing, country, store, and dates.
- Match the metric. Check which downloads count, whether revenue is gross or net, and whether the display rounds the number or gives a threshold.
- Check the trend. If the gap matters, compare several months with the same filters or check the estimate against first-party data for an app you own.
What Revenue per Download Tells You
Revenue per download (RPD) is estimated store revenue divided by estimated downloads for the same market and period. For example, $20,000 in estimated store revenue divided by 50,000 estimated downloads gives an RPD of $0.40. Some of that revenue may come from people who downloaded months earlier. To estimate lifetime value, I’d track how much users who installed around the same time spend as a group.
When Are Paid App Intelligence Tools Worth It?
Match the Tool to Your Research Task
If I’m deciding whether to build an app, I’d use free charts to find a few close rivals, then check recent demand in the country where I’d launch. For the full process, see how to validate an app idea with market research.
If I’m already operating an app, I’d look for ranking history and set up competitor app monitoring for changes I can act on, such as a new release. If I also need to follow changes outside the stores, I’d compare competitor monitoring tools.
If I’m sizing a market for a team, I’d check which stores and countries the tool covers before using its estimates as a market benchmark. I’d also make sure we can export the results and repeat the comparison with the same filters next month. For a repeatable process, see the mobile app intelligence workflow.
Upgrade for More History, Filters, Exports, or Alerts
I’d upgrade once I can name the thing the free view can’t answer.
- I need to tell a launch spike from steady growth. I’d pay for a longer history.
- I’m reporting on five rivals every month. I’d pay for enough comparison slots or exports to avoid rebuilding the report by hand.
- I’m choosing between two launch markets. I’d pay for country-level data after confirming both markets are covered for my apps.
- I need to catch changes as they happen. I’d check which events trigger alerts and whether the frequency matches my workflow.
Before paying, I’d run the same competitor lookup on my shortlist. I’d upgrade when a paid feature gives me an answer I can use or saves work I have to repeat.
FAQs About App Intelligence
How do app intelligence tools differ from app analytics tools?
App intelligence tools combine signals such as app store rankings with estimates of competitor downloads and store revenue. First-party app analytics tools measure what users do in my own app, such as where they drop out of onboarding or whether they come back.
Can I see app download and revenue estimates for free?
Yes, if the free view covers the app and market you need. Appfigures offers recent worldwide snapshots, AppTweak lists past-month estimates on its free Market Intelligence plan, and Appark Free includes estimates in its Downloads & Revenue Rankings. Use the free and paid comparison to check which access type fits your lookup.
Can I check a competitor’s downloads by country?
Yes, if the provider covers that app and country on the plan you’re using. I’d set the country, store, and month before I compare rivals so I can use the estimate to assess demand in that market.
Do app revenue estimates include ads or web subscriptions?
Appark and Similarweb estimate store revenue from eligible store transactions and exclude ads and subscriptions paid on the web. I’d check the provider’s definition before using the figure to size up a business that makes money across several channels. See what store revenue includes and Similarweb’s revenue definition.
How accurate are app download and revenue estimates?
Accuracy varies by app, market, period, and model, so I use estimates to compare rough scale and track changes over time. For an app I own, I can compare the estimate with my first-party data after matching the country, store, period, and metric definition.
Can I get alerts when a competitor updates its app?
Yes, some tools let you follow version releases or supported store listing changes. Appark Free lets you monitor one app. Check which events are supported and how notifications are delivered in the Appark monitoring guide.
If you’re starting from scratch, open the Appark Downloads & Revenue Rankings and pick one competitor you care about. I’d use one rival, one market, and one month to see which of these app intelligence tools answers my first question.