


How to Use Mobile App Intelligence (Without the $74k)
Your analytics dashboard knows everything about your own app. Installs, retention, session length, crash rate — down to the last decimal, every hour of every day.
It knows nothing about the other 2.5 million apps on Google Play fighting for the same installs.
That gap is exactly what mobile app intelligence fills. And if you've been ignoring it because "those tools cost a fortune," you're half right: the median Sensor Tower contract runs $74,415 a year (per Vendr's transaction data, covering 38 purchases). But that number hides the part nobody tells you — the most valuable 20% of app intelligence work runs on a free tier today.
Here's why this matters now, more than ever. Global app downloads grew just 0.8% in 2025, reaching 149 billion, while in-app purchase revenue climbed 10.6% to $167 billion (Sensor Tower, State of Mobile 2026). Read those two numbers again. The market has stopped growing by finding new users. It grows by taking users — and revenue — from someone else. Meanwhile, the top 1% of publishers captured 92% of all in-app purchase revenue last year. If you're a small team making decisions on gut feel, you're playing chess against people staring at the board through a satellite.
This guide covers what mobile app intelligence actually is, what data it gives you, how it differs from regular app analytics, and — the part almost every other guide skips — a 6-step workflow you can run today with free tools to research any competitor.
What Is Mobile App Intelligence?
Mobile app intelligence is the practice of collecting and analyzing market data about apps — any app, not just yours. Download estimates, revenue estimates, store rankings, reviews, monetization models, sometimes even the SDKs a competitor's app is built with. All of it gathered from the outside, without the app owner's cooperation.
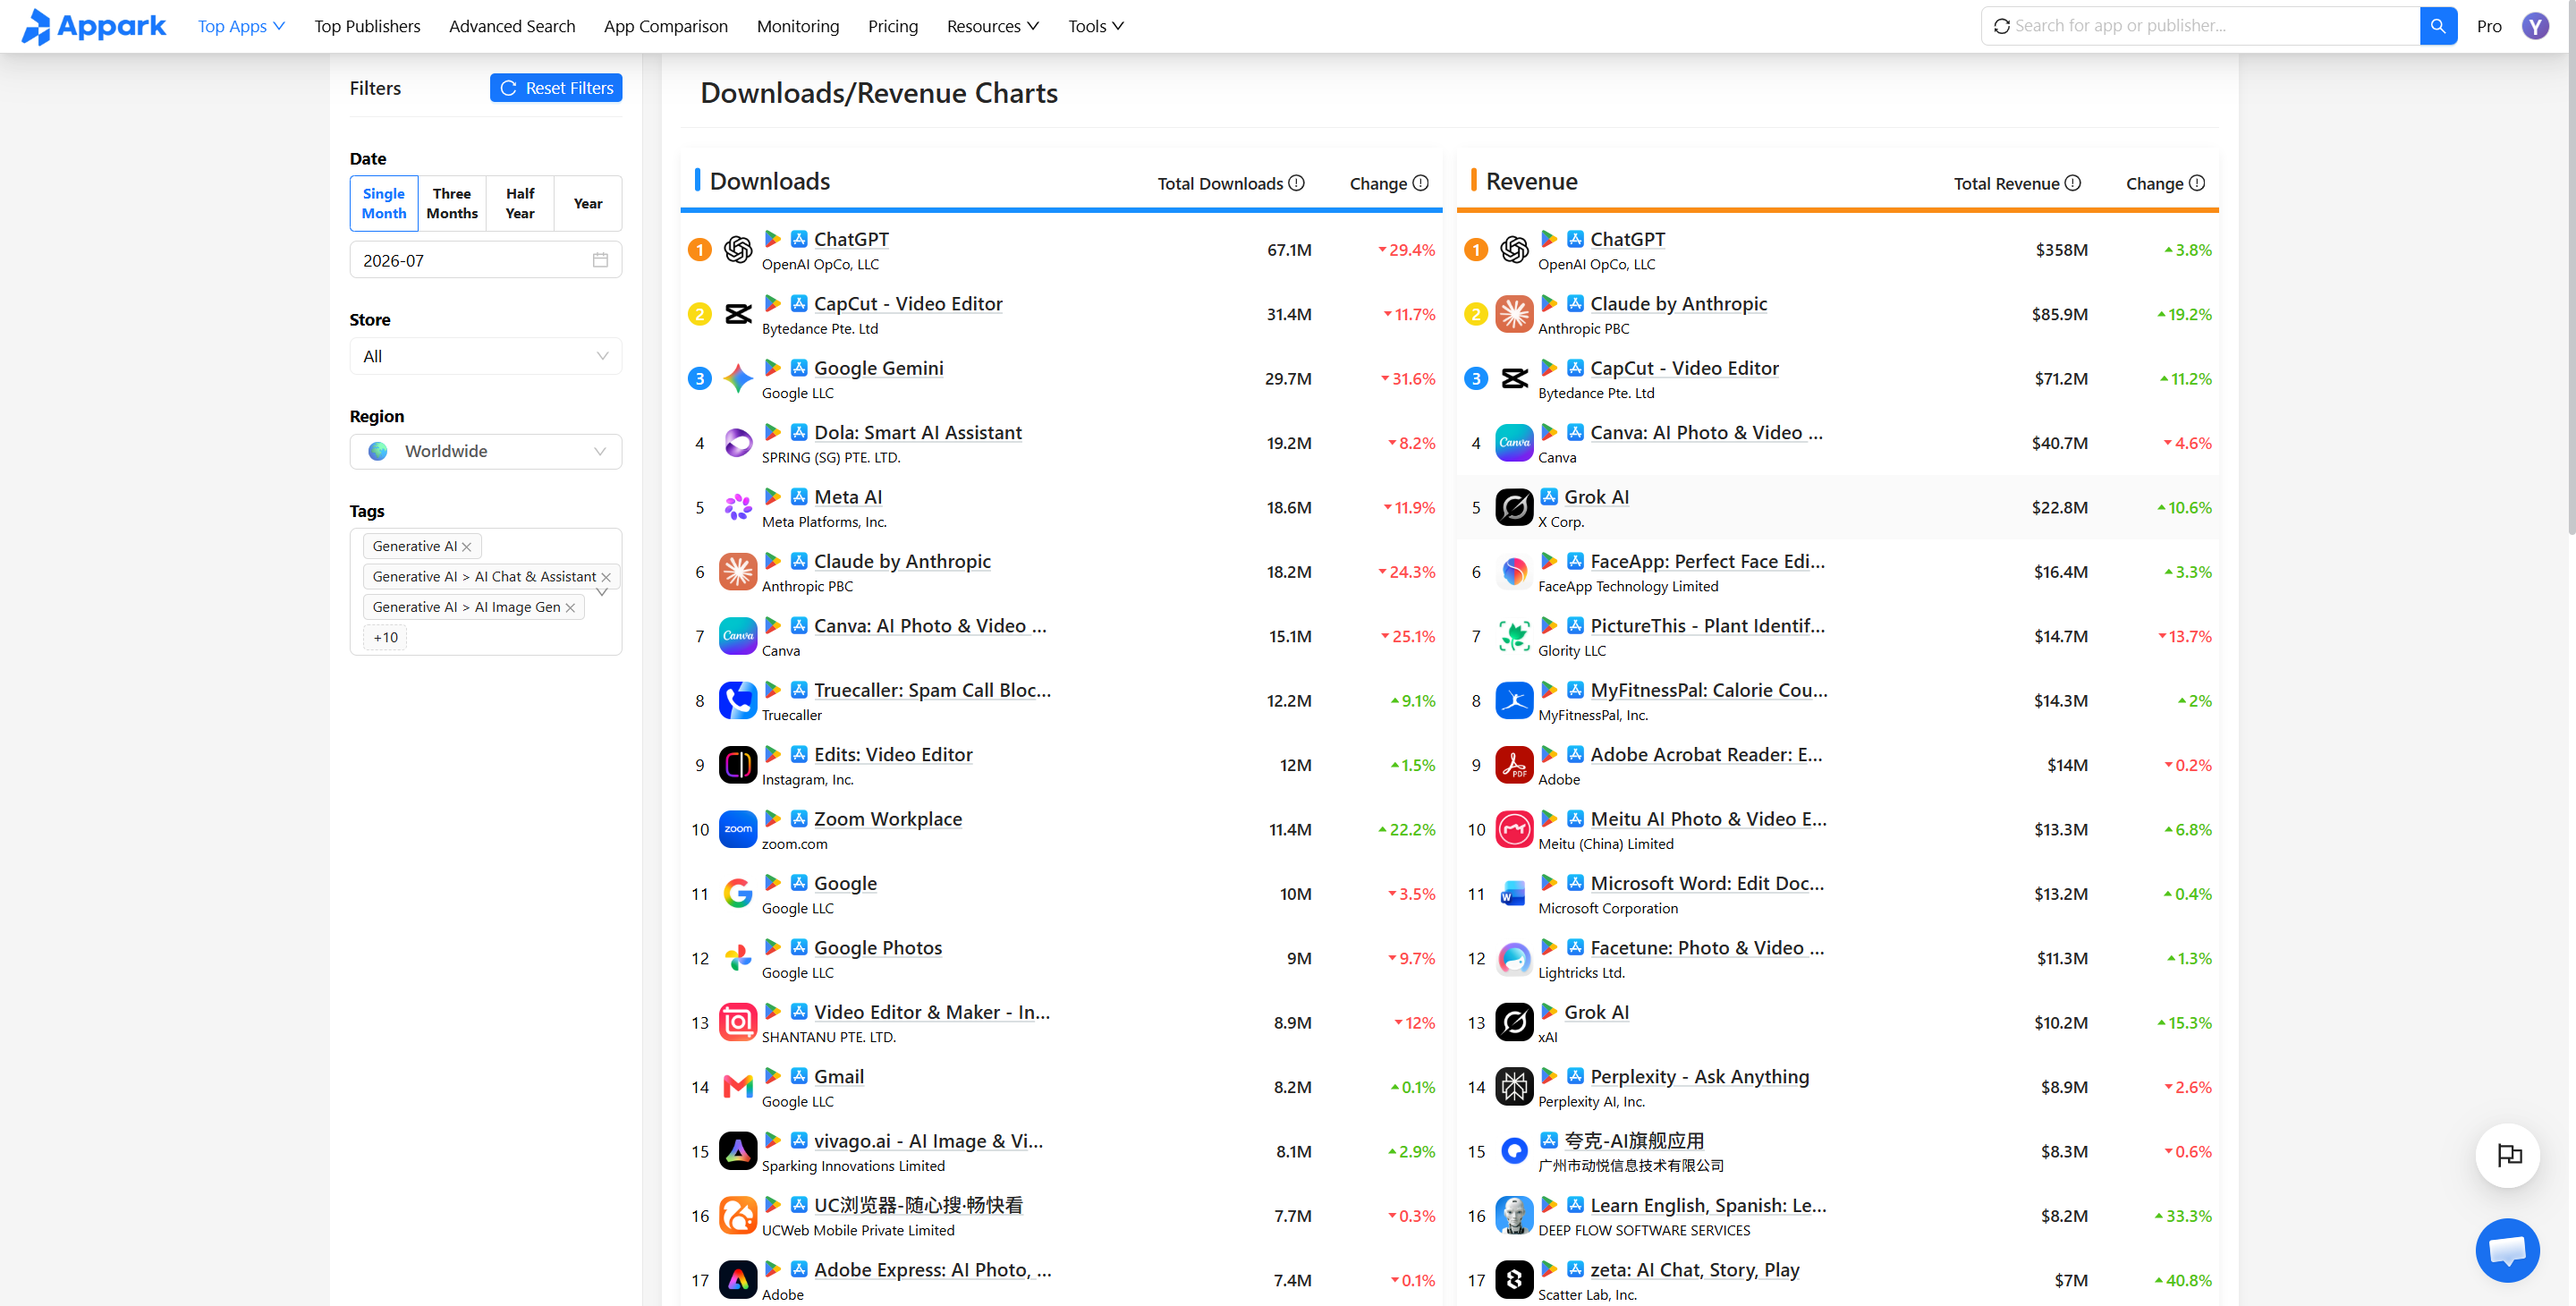
If that sounds abstract, make it concrete with one real number: in 2025, ChatGPT booked $3.4 billion in in-app purchase revenue, making it the third-highest-grossing app of the year behind TikTok and Google One (Sensor Tower, State of Mobile 2026). A single data point like that reshapes how an indie developer thinks about the AI app category — what's monetizable, at what scale, and how far the ceiling actually is. That's app intelligence in one sentence: market facts you can act on.
Contrast that with what most teams actually do. They check a competitor's App Store page once a month, maybe read the reviews, and call it research. The problem isn't effort — it's that store listings only show what the publisher wants you to see. The charts, the estimated downloads, the revenue nobody publishes, the trend line that reveals whether that "successful" competitor is actually rising or quietly dying — none of that is visible from the storefront. Mobile app intelligence lives in that gap: everything the store won't show you about every app in it.
App Intelligence vs. App Analytics: What's the Difference?
These two terms get tangled constantly, and untangling them is worth two minutes because they answer completely different questions.
| App analytics | Mobile app intelligence | |
|---|---|---|
| What it measures | Your own app, via an SDK embedded in it | Every published app on the market, from the outside |
| Typical tools | Firebase, Amplitude, Mixpanel | Sensor Tower, Appfigures, Appark |
| Data you get | Your installs, events, funnels, retention | Competitor downloads, revenue, rankings, reviews, SDKs |
| Question it answers | "Did my new onboarding lift D7 retention?" | "How is my competitor monetizing, and is it working?" |
| Typical cost | Free to low | Free tier (Appark) |
App analytics measures your app from the inside. Mobile app intelligence estimates everyone's apps from the outside — including, crucially, the competitors who will never hand you their Firebase login.
A serious growth team runs both. The analytics stack tells you what's happening inside your funnel; app intelligence tells you whether your numbers are good for your category. A 26% Day-1 retention looks fine until you learn that's roughly the cross-category average — and Day-30 retention across all apps sits around 5–7% (Adjust/AppsFlyer data cited in Review42's app usage statistics). Context is the product. Without it, your own dashboard is a mirror in a locked room.
What Data Does Mobile App Intelligence Cover?
A full mobile app intelligence platform pulls together several data layers. Here's what each one actually tells you, with 2025/2026 real-world numbers to anchor them.
1. Download estimates. How many installs an app is getting, per market, per store. Global downloads hit 149 billion in 2025 — nearly flat, which is precisely why knowing where installs still grow matters. Video streaming grew 39% on the back of short drama; finance apps passed 8 billion downloads for the first time. Category-level download momentum is the cheapest signal of market demand you'll ever get.
2. Revenue estimates. Estimated in-app purchase and subscription revenue. The non-game side of the market crossed a historic line in 2025: apps out-earned games for the first time (85.6Bvs85.6Bvs81.8B, per Sensor Tower). If your mental model of app revenue is still "games print money," the data moved on two years ago.
3. Usage and retention benchmarks. Total time in apps hit 5.3 trillion hours in 2025 — about 3.6 hours per user per day, up just 1.1%. Users open around 34 apps a month but return daily to only about 10. Engagement is concentrating, not expanding.
4. Store rankings. Hourly-updated top charts (Free, Paid, Top Grossing) across markets. Rankings are the rawest form of app intelligence data — they're factual, not modeled — and rank movement is often the earliest public signal of an app taking off or collapsing.
5. Reviews and ratings. Volume, sentiment, and themes across languages. A competitor's 1-star reviews are a free, brutally honest product roadmap of what their users want fixed.
6. SDK and tech stack detection. Which analytics SDKs, ad networks, and payment infrastructure a competitor ships — some enterprise platforms specialize in this. The store listing tells you what a company wants to be seen as; the build tells you what it committed to.
7. Publisher-level rollups. Downloads and revenue aggregated by publisher, so you can see whether you're competing with a solo developer or a 40-app portfolio company.
How are these estimates actually built?
Since we're being honest about what mobile app intelligence can and can't do, you should know where the numbers come from. Platforms build estimates from three raw ingredients: store chart positions (public and factual), consumer panels and usage surveys (sampled), and SDK detection signals baked into published apps. Models then extrapolate from chart rank to download volume, and from downloads plus category monetization patterns to revenue.
This is why two platforms can disagree about the same app by 20–30% and both be useful. The absolute number is a modeled estimate; the trend — up or down, faster or slower than the category — is where the signal lives. Any mobile app intelligence platform worth using will tell you this themselves. Any one that promises exact competitor revenue is selling you confidence you shouldn't buy.
Who Uses Mobile App Intelligence?
The data layers above get used very differently depending on who's holding them:
- Indie developers and small teams use it to validate ideas before writing code — checking whether a niche has real download volume, or which subcategory isn't yet saturated by publishers with 30-app portfolios. If this is you, start with a free app intelligence tool and an hour of chart-reading before your next sprint planning.
- Product managers benchmark features against category leaders and watch review sentiment to prioritize roadmaps.
- Growth and ASO marketers track competitor rankings, creative strategies, and category momentum to time campaigns.
- Investors and analysts use download and revenue estimates for market sizing and due diligence — Apple's App Store alone facilitated $1.4 trillion in developer billings and sales in 2025 (Apple Newsroom), and app intelligence data is how outsiders read that economy.
- Agencies run the whole workflow on behalf of clients who'd rather buy answers than tooling.
Notice what's missing from that list: nobody said "because it's fun." Mobile app intelligence is a decision tool. Which means the right question isn't "what data can I get" but "what decision am I funding with it." The indie developer validating a niche and the investor sizing a category might pull identical charts — and walk away with completely different decisions. The data is the same; the question you bring to it is what makes app intelligence useful instead of just interesting.
How to Research Competitors with App Intelligence: A 6-Step Workflow
Most guides stop at definitions and tool lists. Here's the part they skip — the actual work, end to end. This is the mobile app intelligence workflow we run at Appark when researching a category, and it works the same whether your budget is zero or enterprise. We'll use a running example: you're an indie developer considering an AI photo editor. (Bad timing? Maybe. Let's find out with data instead of vibes.)
Step 1: Define the battlefield. Pick your category and market explicitly. "AI photo & video apps, US App Store" is a researchable question; "apps kind of like mine" is not.
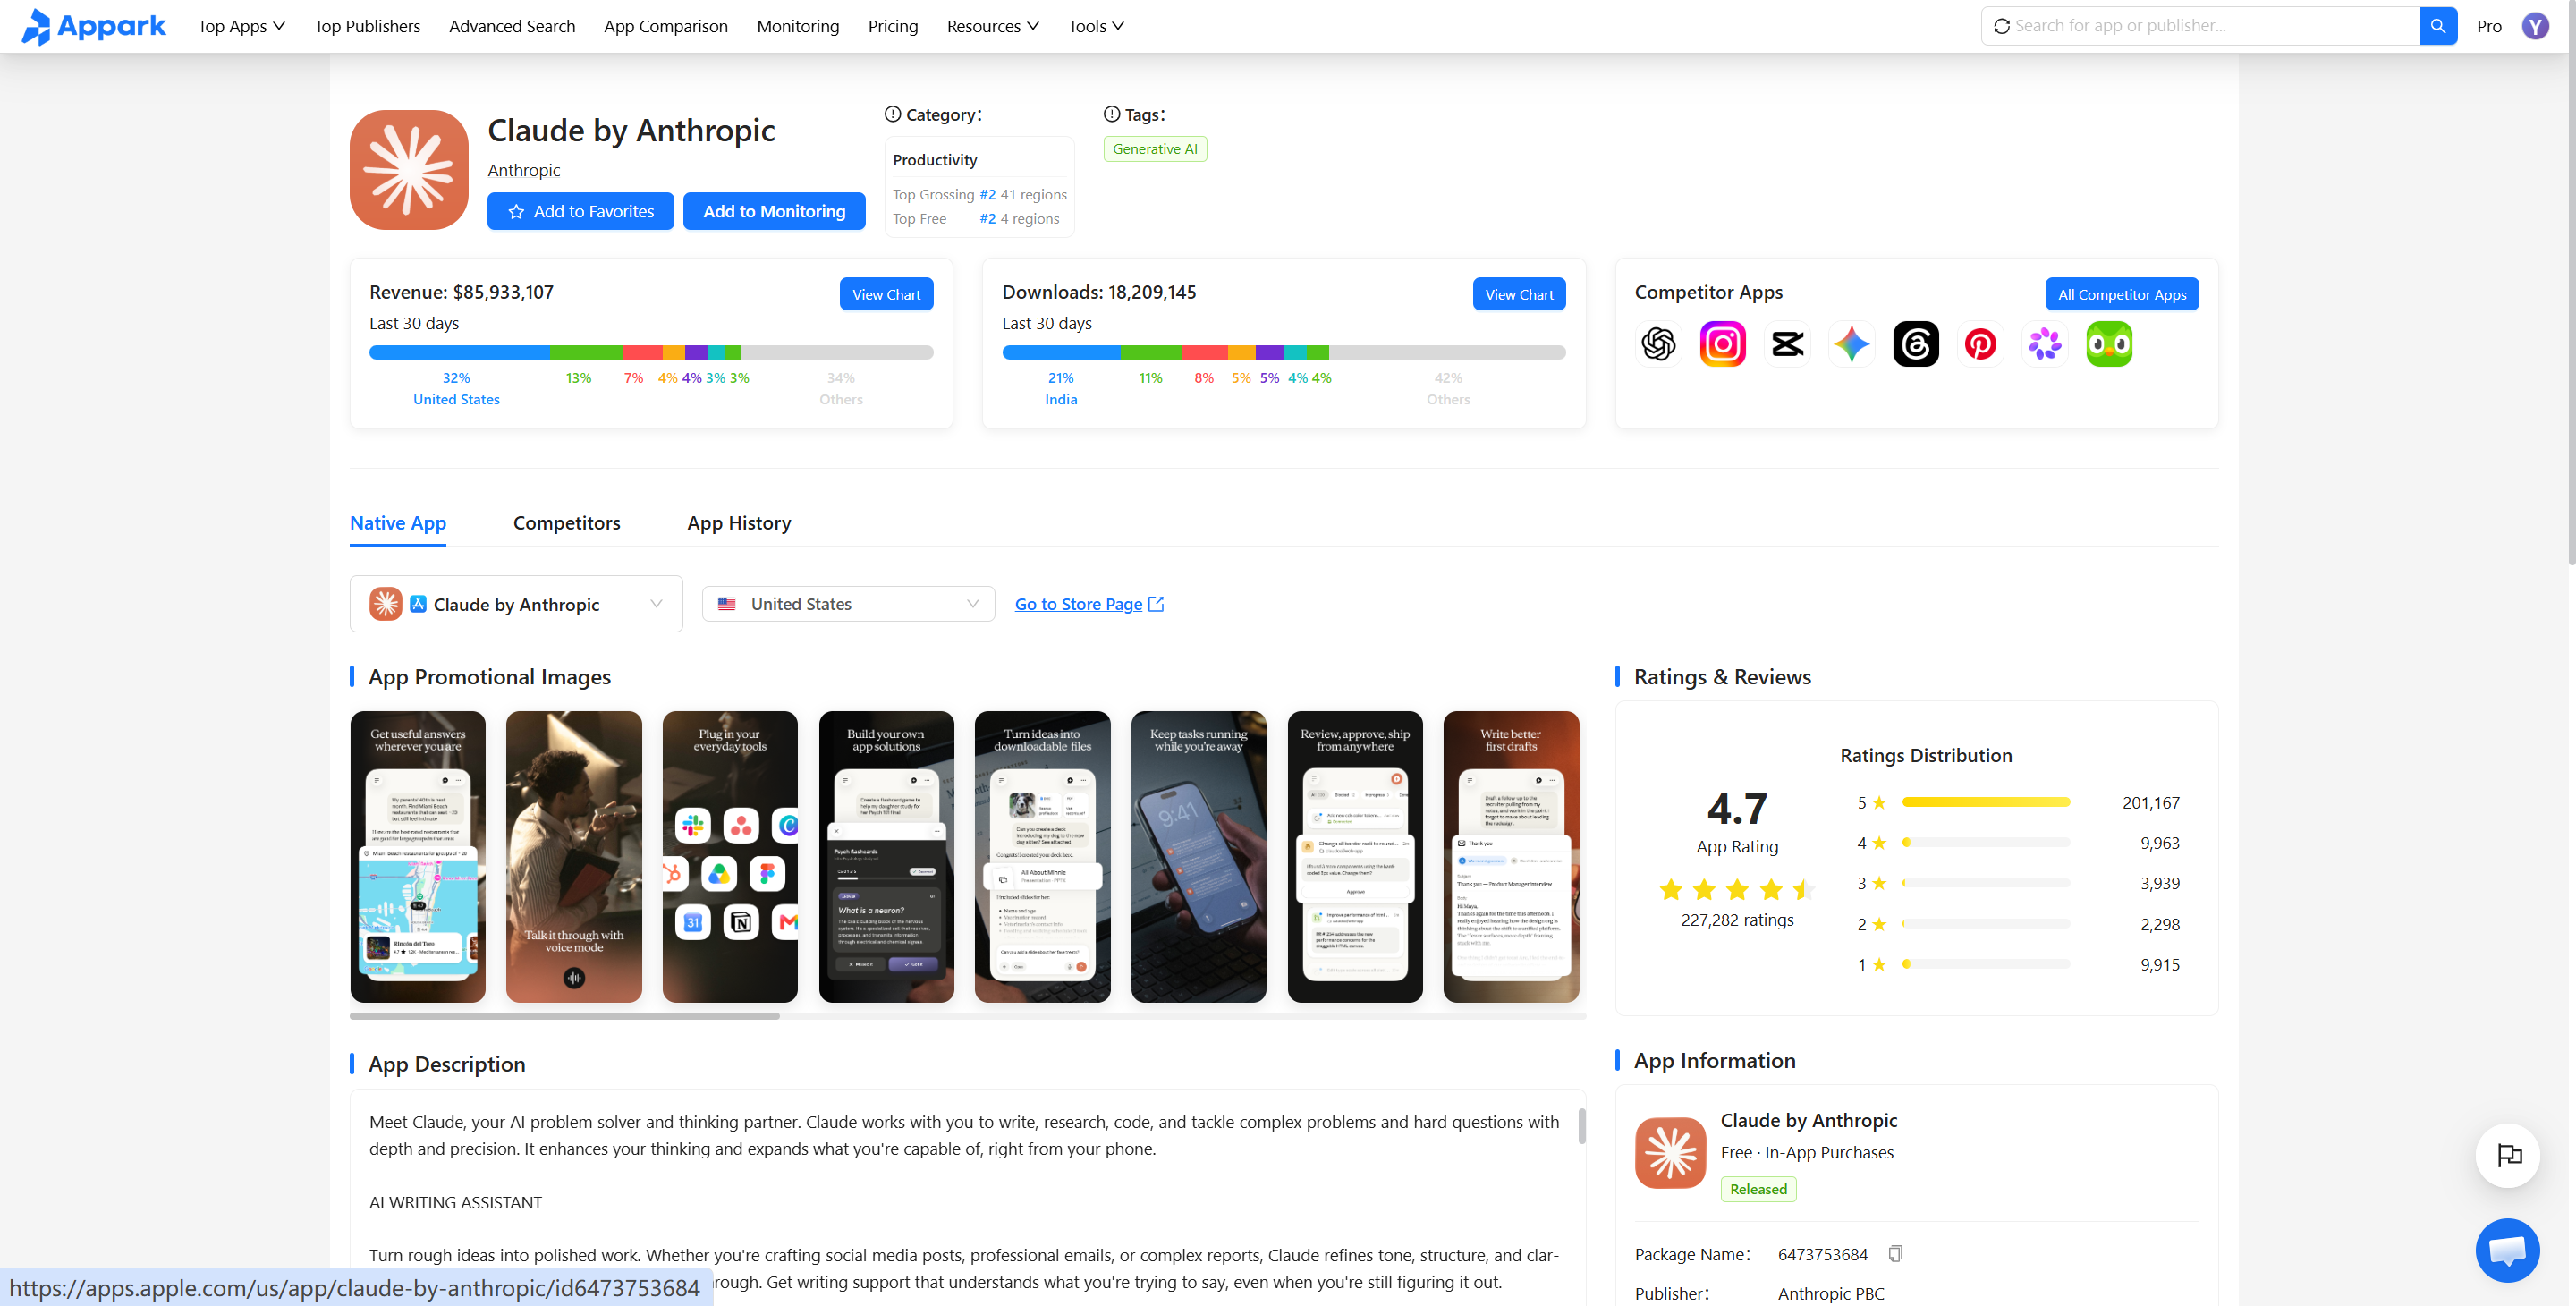
Step 2: Read the top charts for market structure. Pull the current Top 200 Free and Top Grossing charts for your category-market combo. You're looking for concentration: is the head dominated by giants (in AI apps, yes — ChatGPT alone topped annual downloads for the first time in 2025), and more importantly, does anything smaller still chart? Check Appark's live top charts — free, hourly-updated across the App Store and Google Play in 40+ markets, with estimated downloads and revenue for the last 30 days right next to each ranking.
Step 3: Filter for your real competitors. The top of the chart isn't your competitive set — those are category context. Your actual benchmarks are apps at your scale. Use Appark's advanced search: 9 filters across 7M+ apps, so you can ask narrow questions like "photo & video apps, released in the last 18 months, with downloads between X and Y." Export the results in one click. This single step — comparing against apps at your scale instead of against Adobe — is what separates useful app intelligence from discouragement.
Step 4: Compare the shortlist side by side. Take your 5–10 filtered apps into a side-by-side comparison. Watch five things: downloads, revenue, ranking trend, ratings, and momentum direction. Two apps with identical download counts can be in opposite situations — one coasting on a dead 2024 launch, one compounding weekly. The trend line tells you which is which.
Step 5: Monitor changes over time. A snapshot ages fast; the signal is in the delta. Add up apps to Appark's free monitoring list and get a daily email digest covering the three updates that matter: new releases entering your space, ranking shifts, and rating changes. No login gymnastics — the digest lands in your inbox.
Step 6: Turn data into a decision. End every research session with a written answer to one question: "What does this change about what I'll do next month?" Maybe the AI photo editor data says the head is fortified and monetization is subscription-heavy — so you pivot to an underserved subcategory, or rethink pricing. Maybe it says the opposite. Either way, you've replaced a gut call with a market fact. That's the entire job of mobile app intelligence — and notice that everything in this workflow used free data. The barrier to entry was never the cost of the tools; it was knowing the steps.
(For a deeper dive into the analytics side of house — measuring your own funnel once the research is done — see our mobile marketing analytics guide. And if you're earlier in the journey, our profitable app ideas analysis based on market data shows this same workflow applied to idea validation.)
Mobile App Intelligence Tools in 2026: Free and Paid
The tooling landscape changed shape in the last two years, and older blog posts will actively mislead you. The short version: data.ai (formerly App Annie) no longer exists — Sensor Tower acquired it in March 2024 and folded its datasets in through 2025. The old "Sensor Tower vs. data.ai" comparison is dead. What's left is one enterprise heavyweight, several focused independents, and a growing free tier. Here's the 2026 field, organized the way nobody else organizes it — by budget:
| Tier | Tool | Pricing (Aug 2026) | Best at |
|---|---|---|---|
| Free to start | Appark | Free tier covers core research; paid plans unlock more data as you go | Top 200 charts (hourly, 40+ markets), 7M+ app database, 9-filter advanced search, side-by-side comparison, 50-app monitoring with daily email digests |
| Under $100/mo | Appfigures | 9.99–9.99–1,399.99/mo, free tier | Own-portfolio reporting with market context |
| AppTweak | 79–79–549+/mo | ASO with market intelligence layers | |
| Quote-based (mid) | AppMagic | Free plan available | Download/revenue estimates, games focus |
| Apptopia | Quote | SDK intelligence, data feeds | |
| MobileAction | Quote, free ASO tools | ASO + ad creative intelligence | |
| Enterprise | Sensor Tower | ~30k–30k–150k+/yr (Vendr median: $74,415) | Full market intelligence: usage, ads, web — the board-deck standard |
| Similarweb | Quote | Web + app in one view |
There's a second, quieter shift happening in mobile app intelligence tooling: the free tier is getting good. Five years ago, "free app market data" meant a static blog post with last quarter's numbers. Today a free account gets you hourly chart data on 7M+ apps, filtered search, and daily monitoring emails — a workflow that would have cost four figures a month when data.ai was still independent. The enterprise tier still earns its price for board-level work. For everything below that, the excuse for not looking at the market has quietly disappeared. And when your research outgrows the free tier, freemium platforms step up in increments measured in tens of dollars a month — not the $30,000 minimum of an enterprise sales conversation.
How to Choose: Match the Tool to Your Decision
Instead of ranking tools by features, rank them by the decision you're funding. That single reframe is the most useful thing you can take from any mobile app intelligence buying guide:
- Validating an idea or scoping a niche → a free app intelligence platform covers you (charts + filters + comparison). Upgrade only when you find yourself hitting limits weekly.
- Running ASO programs → AppTweak or Appfigures; a full market intelligence suite is overkill.
- Benchmarking your own portfolio against the market → Appfigures.
- Games-specific research → AppMagic (sub-genre and monetization classification matters most in games).
- Market entry, investor sizing, board-level claims → Sensor Tower. When the number has to survive diligence, it needs to be the estimate that's cited by the Wall Street Journal and Bloomberg.
- Web and app together (marketplaces, fintech) → Similarweb.
One calibration rule applies at every tier: app intelligence estimates are directional, not exact. They're modeled from panels and store signals, so absolute numbers will never match a competitor's internal dashboard — trends, rankings, and relative comparisons are where they're reliable. Calibrate once against an app whose real numbers you know (your own), then trust the deltas.
FAQs About Mobile App Intelligence
Q1: Is app intelligence data accurate?
Directionally strong, never exact. Estimates are modeled from consumer panels, store data, and SDK detection, so treat absolute numbers as ranges and trends as the signal. Calibrate against an app whose real figures you know. Two platforms can disagree about the same app by 20–30% and both be useful — the trend line, not the decimal, is where mobile app intelligence earns its keep.
Q2: Do I need app intelligence if I already use Firebase or Amplitude?
Yes, if competitor or market questions matter to you. Analytics measures your own app from the inside; app intelligence estimates everyone else's from the outside. They answer different questions, and mature growth teams run both — the analytics stack for your funnel, mobile app intelligence for the market around it.
Q3: Are there free app intelligence tools?
Yes. Appark's free tier covers top charts, a 7M+ app database, advanced search, comparison, and monitoring of up to 50 apps, with paid plans available when you need more data depth. Appfigures and AppMagic also have free tiers. Free access generally covers charts and profiles; deep usage and ad data sit behind paid plans everywhere.
Q4: Can I see how much revenue a competitor's app makes?
You can see an estimate, not the exact figure. Revenue estimates from platforms like Appark or Sensor Tower are modeled from store signals and are reliable for comparing apps against each other and tracking trends over time.
Q5: How often does app intelligence data update?
It depends on the data type and platform. Rankings can update hourly; download and revenue estimates typically refresh daily or weekly. For monitoring purposes, daily granularity catches ranking shifts and new releases fast enough for most decisions.
Ready to run the workflow yourself? Start with a category you know and pull its top charts — the free tier covers it, and it takes about the length of a coffee. The 6-step workflow above runs start to finish without paying anything; the paid plans only enter the picture when your data appetite outgrows the free limits.
Because here's the thing about mobile app intelligence that the enterprise pricing tables try to obscure: the fundamentals — who's winning, who's growing, what a category actually pays — have always been readable from the charts. The expensive part was never the insight. It was the access. That barrier is gone now. The only remaining excuse for guessing is the ten minutes you haven't spent looking yet.