


Mobile Marketing Analytics: 2026 Guide & Free Tools
Your team built a beautiful analytics dashboard. Installs, retention curves, LTV, session depth — everything tracked, everything visible. Yet when your CEO asks "are we winning or losing against competitors?", nobody has an answer.
Here's the uncomfortable part: most app teams measure their own data in a vacuum. You know your Day-7 retention is 12%. Is that good? Bad? Average? Without market context, you can't tell. Meanwhile your user acquisition costs keep climbing, Apple's privacy changes broke half your attribution links, and three competitors just climbed past you in the app store rankings — quietly, while you were busy staring at your own funnel.
This is where mobile marketing analytics comes in. Done right, it combines your internal app data with market intelligence and competitor benchmarking, so you can finally tell whether you're winning or getting outmaneuvered. This guide covers what to track, what tools to use, and how to build a setup that answers the questions that actually matter in 2026.
What Is Mobile Marketing Analytics?
Mobile marketing analytics is the practice of collecting, measuring, and interpreting data from your mobile marketing efforts — paid acquisition, organic store presence, in-app engagement, and post-install behavior — to understand what drives growth and what wastes budget.
People use three terms interchangeably, and that causes confusion. Here's the distinction:
- Mobile marketing analytics focuses on the marketing layer: which campaigns, channels, and creatives drive installs and revenue. Think attribution, CPI, ROAS.
- Mobile app analytics is broader. It covers everything happening inside the app, including product analytics and technical performance.
- Mobile analytics (without "app" or "marketing") sometimes refers to mobile web analytics, not apps at all.
If you're a marketer or growth lead, mobile marketing analytics is your lane. It connects ad spend to outcomes and tells you whether your UA dollars are working.
Why Mobile Marketing Analytics Matters in 2026
Three forces changed the game recently, and they all push the same direction: you need better analytics, not more analytics.
Attribution got harder. Since Apple launched App Tracking Transparency with iOS 14.5 in 2021, roughly 75% of iOS users opt out of tracking. Google's Privacy Sandbox for Android is following a similar path. The old model — where you could trace every install back to a specific ad click — is broken. Mobile marketing analytics tools have had to rebuild attribution around probabilistic models and Apple's SKAdNetwork, which gives you less data, delayed.
Ad costs aren't coming down. eMarketer projects global mobile ad spending to surpass $400 billion in 2026. More money chasing roughly the same inventory means higher CPIs. Without solid analytics, you're flying blind with a bigger budget — and that's how teams waste six figures in a quarter.
AI traffic is polluting your data. A 2026 report from HUMAN Security found that AI agent traffic grew by over 7,800% year-over-year. Some of that traffic hits your app store listings, your ads, and your analytics SDKs. If you can't separate bot noise from real user behavior, your metrics lie to you.
The teams winning in 2026 aren't the ones with the most dashboards. They're the ones who can trust their data and act on it.
The Metrics That Actually Move the Needle
Most guides dump 20 metrics on you and call it comprehensive. That's how you end up tracking everything and deciding nothing. Here's a tighter framework — four stages of the user journey, three metrics each, with benchmarks so you know what "good" looks like.
Acquisition — are you getting users efficiently?
| Metric | What it tells you | Benchmark |
|---|---|---|
| CPI (Cost Per Install) | How much you pay per new install | 1–3casualgames;1–3casualgames;5–15+ finance apps |
| Install conversion rate | % of ad clicks that become installs | 5–15% typical |
| Organic lift | Organic installs driven by paid campaigns | 1:1 paid-to-organic is healthy |
According to AppsFlyer's benchmarks, mobile CPIs rose roughly 20% year-over-year across most verticals in 2025. If your CPI is climbing faster than your LTV, you have a problem — and only mobile marketing analytics can surface it early enough to course-correct.
Engagement — are they doing what you hoped?
| Metric | What it tells you | Benchmark |
|---|---|---|
| Day-1 retention | First-impression quality | 25% average across apps |
| Day-7 retention | Early habit formation | 10–15% for most categories |
| Session depth | How much they explore per session | 4–8 screens, category-dependent |
Statista data shows median Day-1 retention across all app categories sits around 25%, meaning a quarter of users never come back after their first session. If yours is below 15%, your onboarding or store listing is setting wrong expectations.
Retention — are they sticking around?
| Metric | What it tells you | Benchmark |
|---|---|---|
| Day-30 retention | Long-term value signal | 4–10% depending on category |
| Churn rate | How fast you're bleeding users | Inverse of retention |
| Stickiness (DAU/MAU) | How often users return | >20% is strong |
Monetization — are they paying?
| Metric | What it tells you | Benchmark |
|---|---|---|
| ARPU | Revenue per user | Varies wildly by category |
| LTV/CAC ratio | Unit economics health | >3:1 to be sustainable |
| In-app purchase conversion | % of users who pay | 2–5% for freemium apps |
The metrics that matter depend on your business model. A subscription app should obsess over trial-to-paid conversion. A game cares about Day-7 retention and IAP rates. Don't track all twelve — pick the three that map to your current growth question.
How to Set Up Mobile Marketing Analytics from Scratch
Starting from zero? Here's a six-step path that won't overwhelm a small team.
Step 0: Check the market first. Before defining your own goals, look at where you stand. What's your app's ranking in its category? How do your download estimates compare to direct competitors? Tools like Appark let you check app rankings, compare competitors side by side, and track market positioning — for free. Knowing your market position before you set internal targets prevents you from aiming too low or panicking over nothing.
Step 1: Define what success looks like. Write down the one metric that, if it improved 20% next quarter, would make the biggest business impact. Everything else is secondary.
Step 2: Choose your metrics. Pick three to five from the framework above. Resist the urge to track more.
Step 3: Install your SDKs. You need at minimum a mobile measurement platform (for attribution) and an in-app analytics SDK (for behavior). We'll cover specific tools next.
Step 4: Build a dashboard, not a spreadsheet. Your dashboard should answer one question per widget. "What's our CPI trend?" is a widget. "Are we winning?" is not — that takes the market intelligence layer we'll discuss shortly.
Step 5: Set benchmarks. Use the tables above plus your own historical data. If you don't have history yet, use competitor data as your starting baseline.
Step 6: Review weekly, not monthly. Mobile marketing analytics is most valuable when you catch anomalies early. A sudden CPI spike on a Tuesday deserves attention on Tuesday, not at month-end review.
The Mobile Analytics Tools Landscape (and Where Free Fits In)
The tool landscape splits into three layers. Most guides throw them into one pile and confuse you. Let's not do that.
Layer 1: Attribution / Mobile Measurement Platforms (MMPs)
These tools tell you which ad caused which install. They're the backbone of any attribution setup.
- AppsFlyer — the market leader. Strong attribution, good SKAN support. Pricing scales with scale.
- Adjust — solid alternative, particularly strong in fraud prevention.
- Branch — best for deep linking + attribution combined.
These are paid tools, and for good reason — attribution infrastructure is complex. Most offer free tiers for small apps.
Layer 2: In-App Product Analytics
Once users are inside your app, these tools tell you what they're doing.
- Mixpanel — event-based analytics with a generous free tier (up to 20M events/month).
- Amplitude — strong funnel and retention analysis. Free tier available.
- Google Analytics for Firebase — free, integrates with Google Ads, but limited depth compared to the above.
Layer 3: Market Intelligence & Competitor Monitoring
This is the layer most teams skip — and it's the one that answers "are we winning?" MMPs and product analytics show your data. Market intelligence shows everyone else's.
- data.ai (formerly App Annie) — download and revenue estimates, market reports. Enterprise pricing.
- Sensor Tower — similar capabilities, store intelligence.
- Appark — free app rankings, advanced search, app comparison, and competitor tracking.
A practical free setup: Firebase (product analytics) + an MMP free tier (attribution) + Appark (market intelligence). That covers all three layers without spending on tools — ideal for indie devs and early-stage teams.
Beyond Your Own App: Market Intelligence & Competitor Benchmarking
Here's the gap that derails most mobile marketing analytics programs. You've got attribution data. You've got in-app behavior data. You can see your own funnel clearly. But you still can't answer: "Is my 12% Day-7 retention good for my category?"
The answer requires market data — and most teams don't have it.
Why your own data isn't enough? Imagine two apps in the same category. App A has Day-30 retention of 6%. App B has 8%. Without market context, App B's team feels confident. But if the category median is 11%, both apps are underperforming — App B just doesn't know it yet.
This happens constantly. Teams celebrate metrics that are below market average, or panic over metrics that are actually fine for their category. The fix is straightforward: benchmark against the market.
What market intelligence tells you that internal analytics can't:
- Ranking trends — is your app climbing or falling in its category? A ranking drop often precedes an install decline by weeks.
- Download and revenue estimates for competitors — are they growing while you plateau?
- Competitor update cadence — when did your top competitor last ship a release? Are they iterating faster?
- Category-level growth — is your entire category growing, or shrinking? This changes your strategy entirely.
How to use Appark for competitor benchmarking? Appark gives you four capabilities that fit directly into a mobile marketing analytics workflow:
- App Rankings — track your position and your competitors' positions across categories and countries. Spot ranking shifts before they hit your install numbers.
- Advanced Search — find apps by keyword, category, or performance metrics. Useful for identifying new competitors entering your space.
- App Comparison — put your app side by side with up to three competitors. Compare at a glance instead of manually switching between store listings.
- Competitor Tracking — set alerts on specific competitors. Get notified when their ranking changes, when they update, or when they enter a new market.
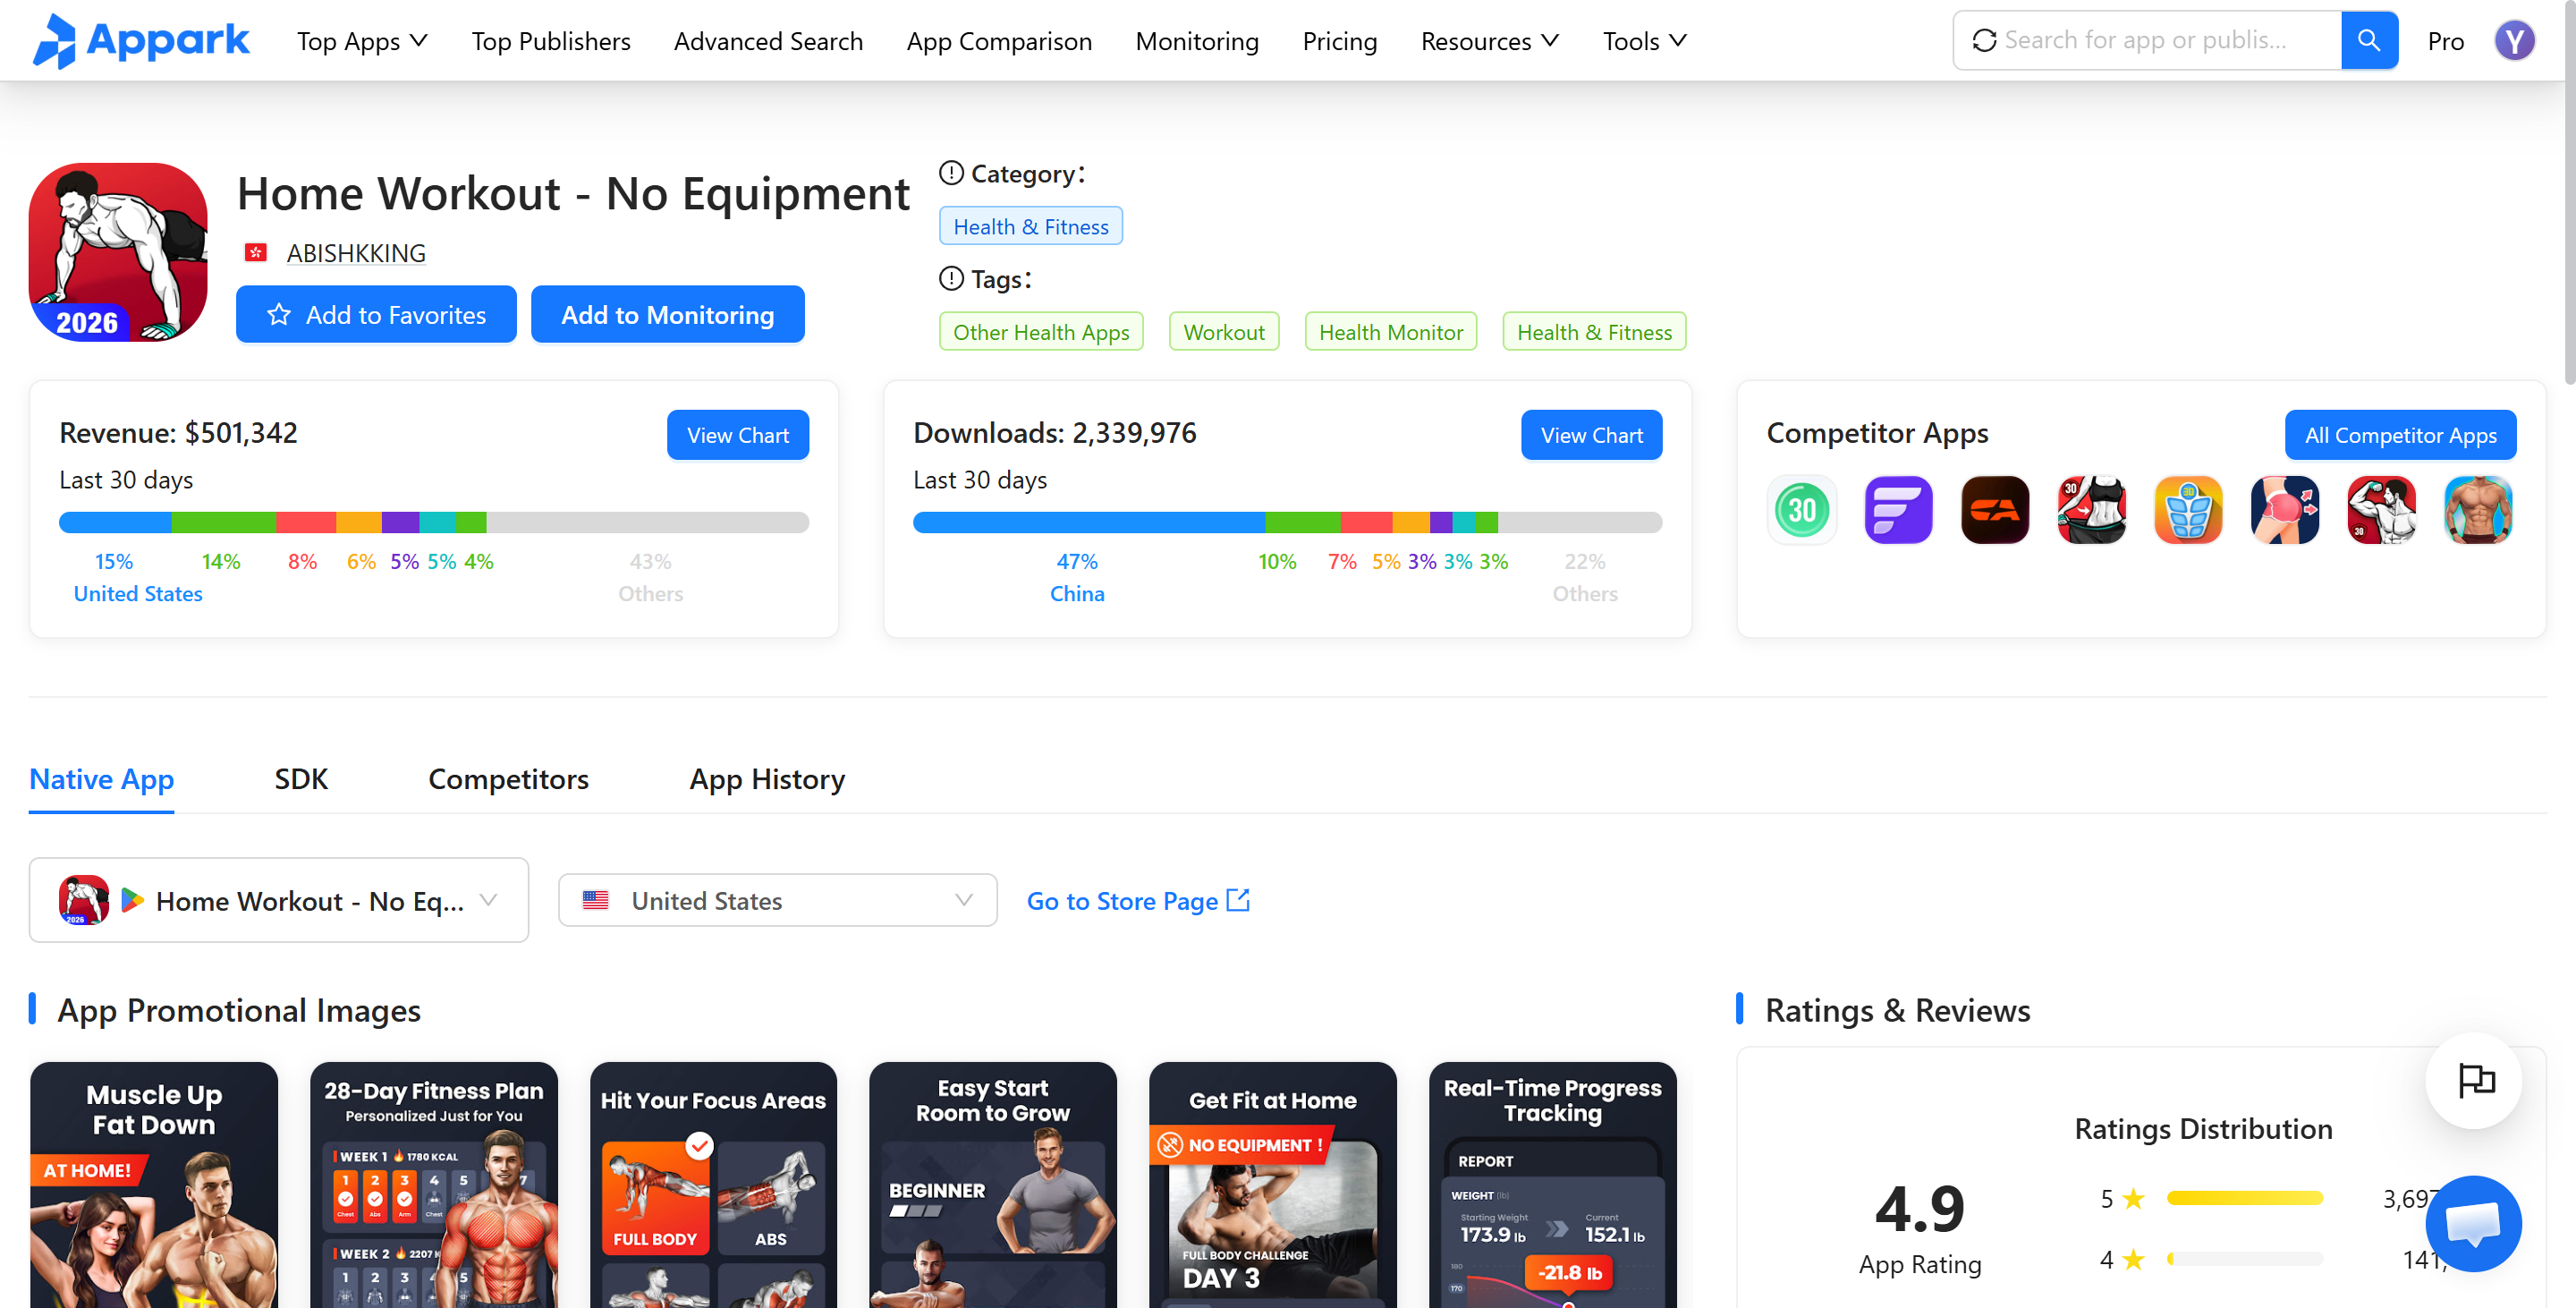
Here's how this looks in practice. Say you manage a fitness app. You notice installs dipped 8% last week. Your attribution tool says campaigns are performing fine — CPI stable, conversion stable. So why the drop?
You check Appark. Your closest competitor just climbed 15 spots in the Health & Fitness ranking. They shipped an update three days ago — new feature, fresh screenshots. Their improved store presence is stealing organic installs from you. Your paid campaigns didn't get worse. The market shifted.
That's the insight internal analytics alone can't give you. And it's why mobile marketing analytics without a market intelligence layer is incomplete.
2026 Trends: Privacy, AI Traffic, and the Future of Mobile Measurement
Three trends will shape how teams approach analytics through the rest of 2026.
Privacy-first attribution is the new normal. Apple's SKAdNetwork (now SKAN 4.0+) and Google's Privacy Sandbox mean deterministic attribution is fading. Google's Privacy Sandbox documentation outlines the Android approach: cohort-based targeting and on-device attribution. The practical impact: your analytics will rely more on modeled conversions and aggregated data. Teams that learn to work with probabilistic attribution now will have a head start.
AI agent traffic is a measurement problem. The HUMAN Security report we referenced earlier isn't just a curiosity. If AI agents are visiting app store pages, clicking ads, and triggering SDK events, your analytics are contaminated. Some tools are adding bot filtering, but many aren't there yet. Ask your MMP whether they filter AI agent traffic — if they can't answer, your data quality is at risk.
Market intelligence is becoming essential, not optional. As internal attribution data gets noisier (privacy) and more polluted (AI traffic), the signal value of your own data decreases. External market data — rankings, download trends, competitor moves — becomes more reliable by comparison. Teams that combine internal analytics with market intelligence will make better decisions than teams relying on internal data alone.
Common Mobile Marketing Analytics Pitfalls (and How to Avoid Them)
Tracking vanity metrics. Total downloads look great in a pitch deck. They tell you nothing about health. Focus on retention, LTV, and ROAS instead.
Ignoring data quality. If 15% of your "installs" are bots or SDK duplicates, every downstream metric is wrong. Audit your data pipeline quarterly.
Treating all attribution as truth. Post-ATT, attribution is modeled, not measured. Understand the confidence intervals on your MMP's numbers. A "50% confidence" attribution isn't a fact.
Siloing mobile from the rest of marketing. If your mobile team and web team use different tools, different metrics, and different definitions of "conversion," you can't compare performance. Align on shared definitions.
Never benchmarking against competitors. The most common pitfall, and the most expensive. Without market context, you can't tell good performance from bad. Use a market intelligence tool — even a free one — to establish baselines.
Over-optimizing for the wrong stage. If your retention is broken, fixing acquisition is pouring water into a leaky bucket. Diagnose with the full funnel before you spend more on ads.
FAQ
What's the difference between mobile marketing analytics and mobile app analytics?
Mobile marketing analytics focuses on the marketing layer — attribution, ad performance, ROAS. Mobile app analytics covers everything in the app, including product behavior and technical performance. Most teams need both.
Do I need an MMP if I'm not running paid ads yet?
Not immediately. But the moment you start spending on user acquisition, an MMP becomes essential. Without it, you can't tell which channel drove which install.
Can I do mobile marketing analytics for free?
Yes, to a point. Google Analytics for Firebase covers in-app analytics at no cost. Appark covers market intelligence and competitor tracking for free. Attribution is the one layer where free options are limited — but MMPs like AppsFlyer and Adjust offer free tiers for small apps.
How often should I review my analytics?
Weekly for operational metrics (CPI, retention, ROAS). Monthly for strategic review (market position, competitor moves, trend analysis). Annually for tool stack audit.
What's a healthy LTV/CAC ratio?
Generally 3:1 or better. Below 2:1, you're likely losing money on each user. Above 5:1, you might be underinvesting in growth.
Mobile marketing analytics in 2026 isn't about more dashboards or more metrics. It's about answering better questions. Are your campaigns profitable? Is your retention healthy for your category? Are you gaining or losing ground against competitors?
Internal analytics answers the first two. Market intelligence answers the third. You need both.
If you're not already benchmarking against your market, that's the highest-leverage gap to close. Appark lets you track app rankings, compare competitors, and monitor market shifts — free, no SDK installation required. Set up competitor tracking today, and next time your CEO asks whether you're winning, you'll have an answer backed by data.