


Mobile Game Monetization Trends 2026: What to Change When Your Current Model Fails
You added rewarded ads, adjusted the starter pack, or put a pass in front of players who had already stopped coming back. Revenue barely moved. The next recommendation was another monetization feature.
That is a frustrating place to be, because the feature may work perfectly. It just may not address the reason your game struggles to earn.
This guide breaks down the core mobile game monetization trends for 2026, explains what they mean for different titles, and shows how to test them systematically using competitor benchmark data.
Research reviewed October 26, 2026. Report periods are identified below; a report published in 2026 may describe 2025 results.
Start with the problem your game needs to solve
According to Sensor Tower’s State of Mobile 2026 analysis, global mobile game in-app purchase revenue reached approximately $82 billion in 2025 (up 1.3% YoY), even as overall downloads experienced slight contractions.
For individual studios, this divergence highlights a fundamental principle: top-of-funnel install volume alone does not determine commercial health.
Before adopting a new monetization trend, isolate your game’s primary bottleneck:
- Drop-offs during session 1: Players are churning before value is established. Optimize core gameplay flow and onboarding UX before introducing purchase options.
- High engagement, low purchase conversion: The baseline offers lack contextual relevance or value clarity. Audit bigh-converting: Opt-in rewarded ads triggered immediately after a failed attempt give players a clear choice at a high-intent moment.
- Churn-inducing: Forced interstitial breaks between active gameplay loops simply push players out of the app.
Testing Recommendation: Roll out a single rewarded placement with a clean A/B test. Group A retains the existing experience; Group B receives the optional rewarded placement. Track total revenue per user (IAP + IAA) and Day-7/Day-30 retention concurrently.
LiveOps & Battle Passes: Building Recurring Retention Hooks
LiveOps (live operations) refers to continuous content updates, limited-time challenges, and competitive seasons deployed to maintain long-term engagement.
In modern monetization loops, paid battle passes sit directly inside these events. Players progress through objective-based milestones, with an optional pass tier unlocking premium rewards.
A paid pass is only as effective as the event surrounding it. If the gameplay loop feels repetitive within two sessions, adding a paid progression track will not recover lapsed players.
AppMagic’s H1 2026 Casual Games Report highlights the Brick Crushers event in Match Villains. Core puzzle levels awarded dedicated tokens, which players then spent in an auxiliary brick-breaking mini-game. The event combined tiered milestone rewards, themed promotional bundles, and dual paid passes.
The underlying progression loop connects engagement directly to reward milestones:
Core Gameplay ➔ Event Currency ➔ Auxiliary Mini-Game ➔ Progressive Pass Rewards
Purchases are embedded directly into activities players are already motivated to complete.
Testing Recommendation: For indie and mid-sized studios, begin with a predictable 48-hour weekend challenge. Validate whether engagement and return rates lift before committing production overhead to multi-tier battle passes or recurring subscriptions.
Web Shops & Direct-to-Consumer (D2C) Channels
A web shop enables players to purchase digital currencies and content bundles through an external web portal, which are then synchronized to their mobile player account.
Industry adoption expanded markedly throughout 2025 and 2026:
- GameRefinery’s April 2026 Market Review documented titles such as Last Z and MLB Perfect Inning introducing exclusive currencies routed primarily through external storefronts.
- BCG’s Video Gaming Report 2026 reported that 33% of surveyed adult gamers (across a cross-platform sample of 2,972 respondents) had completed a transaction via a publisher's web shop.
Margin Math vs. Friction Cost
While direct storefronts circumvent standard 15–30% platform store commissions, net margin gains must be weighed against operational overhead:
Net Margin = Gross Sales − (Payment Processing + Merchant of Record Fees + Customer Support & Fraud + Web Acquisition Costs)
Furthermore, directing a mobile player to an off-app browser adds cognitive and technical friction. Web shops deliver value once you have established a dedicated cohort of repeat spenders; they are rarely effective at converting first-time buyers.
Benchmarking Monetization by Genre
Monetization efficiency varies dramatically across sub-genres. A casual match-3 game and a 4X strategy game operate on fundamentally different ARPU horizons.
According to AppsFlyer’s App Monetization Report, global Day-90 cumulative in-app purchase revenue per user averaged:
- Casino: $2.43
- Midcore: $2.13
- Casual: $1.34
(Note: Day-90 figures reflect cumulative gross IAP revenue averaged across all tracked cohort installs over their first 90 days, not single-day revenue or paying-user-only averages.)
Use industry metrics as directional context rather than rigid targets:
| Player Behavior Observed | Primary Diagnostic Focus | Practical Test Strategy |
|---|---|---|
| Regular sessions, low conversion | Offer value clarity and trigger timing | Test a contextual milestone bundle after high-friction levels |
| Session drop-off near ad placements | Interruption fatigue / UX friction | Swap forced interstitials for opt-in rewarded video slots |
| Single purchase with zero repeat spend | Post-purchase progression vacuum | Introduce a weekly milestone challenge with tiered rewards |
| Core group of repeat high-value spenders | Platform fee drag on margins | Pilot a dedicated web shop offering bonus currency bundles |
Competitor Research Workflow with Appark
Before building new monetization systems, analyze how relevant competitor titles balance downloads, estimated store revenues, and feature cadence.
The following steps outline an objective benchmarking workflow using Appark:
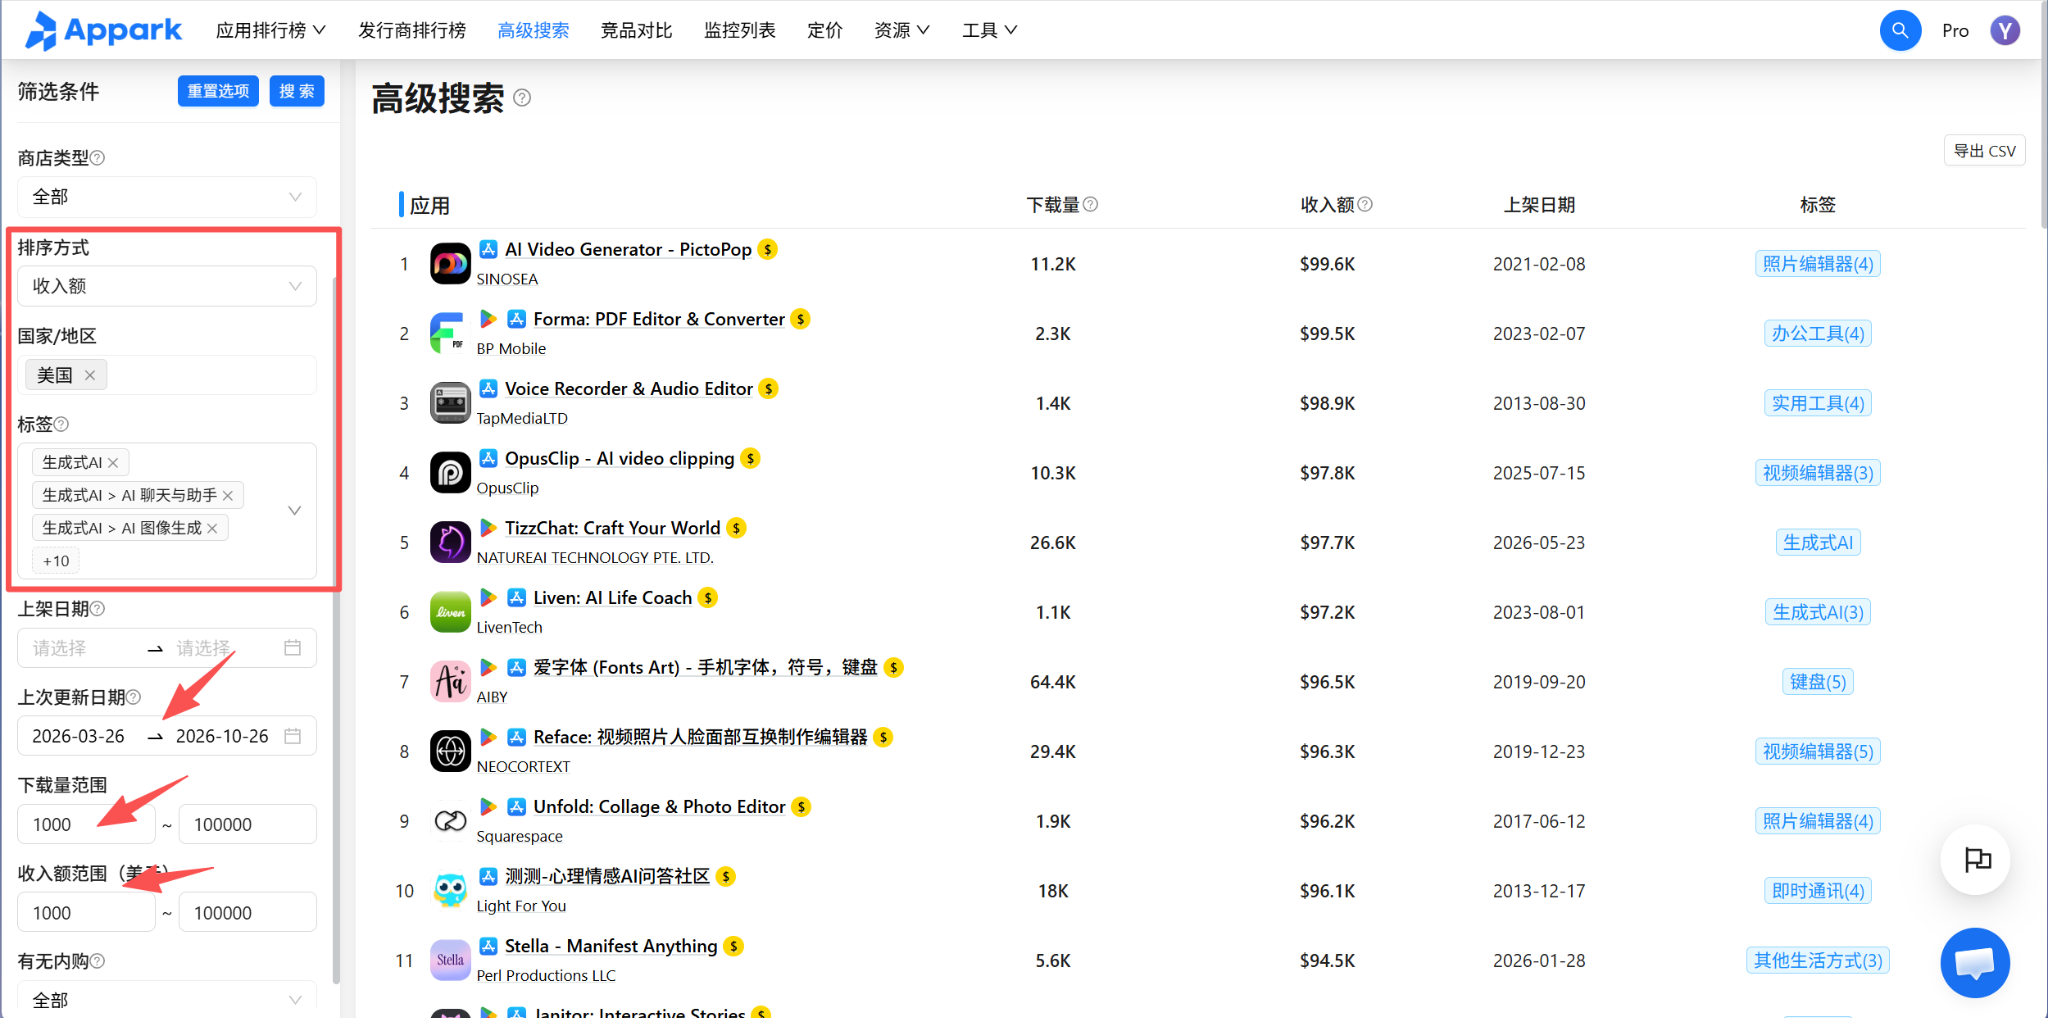
Step 1: Establish a Consistent Baseline Scope
Open Appark’s Downloads & Revenue Rankings. Select a defined market (e.g., United States), store ecosystem (App Store or Google Play), and a complete monthly date range.
Examine top titles within your target sub-genre alongside games operating near your current scale.
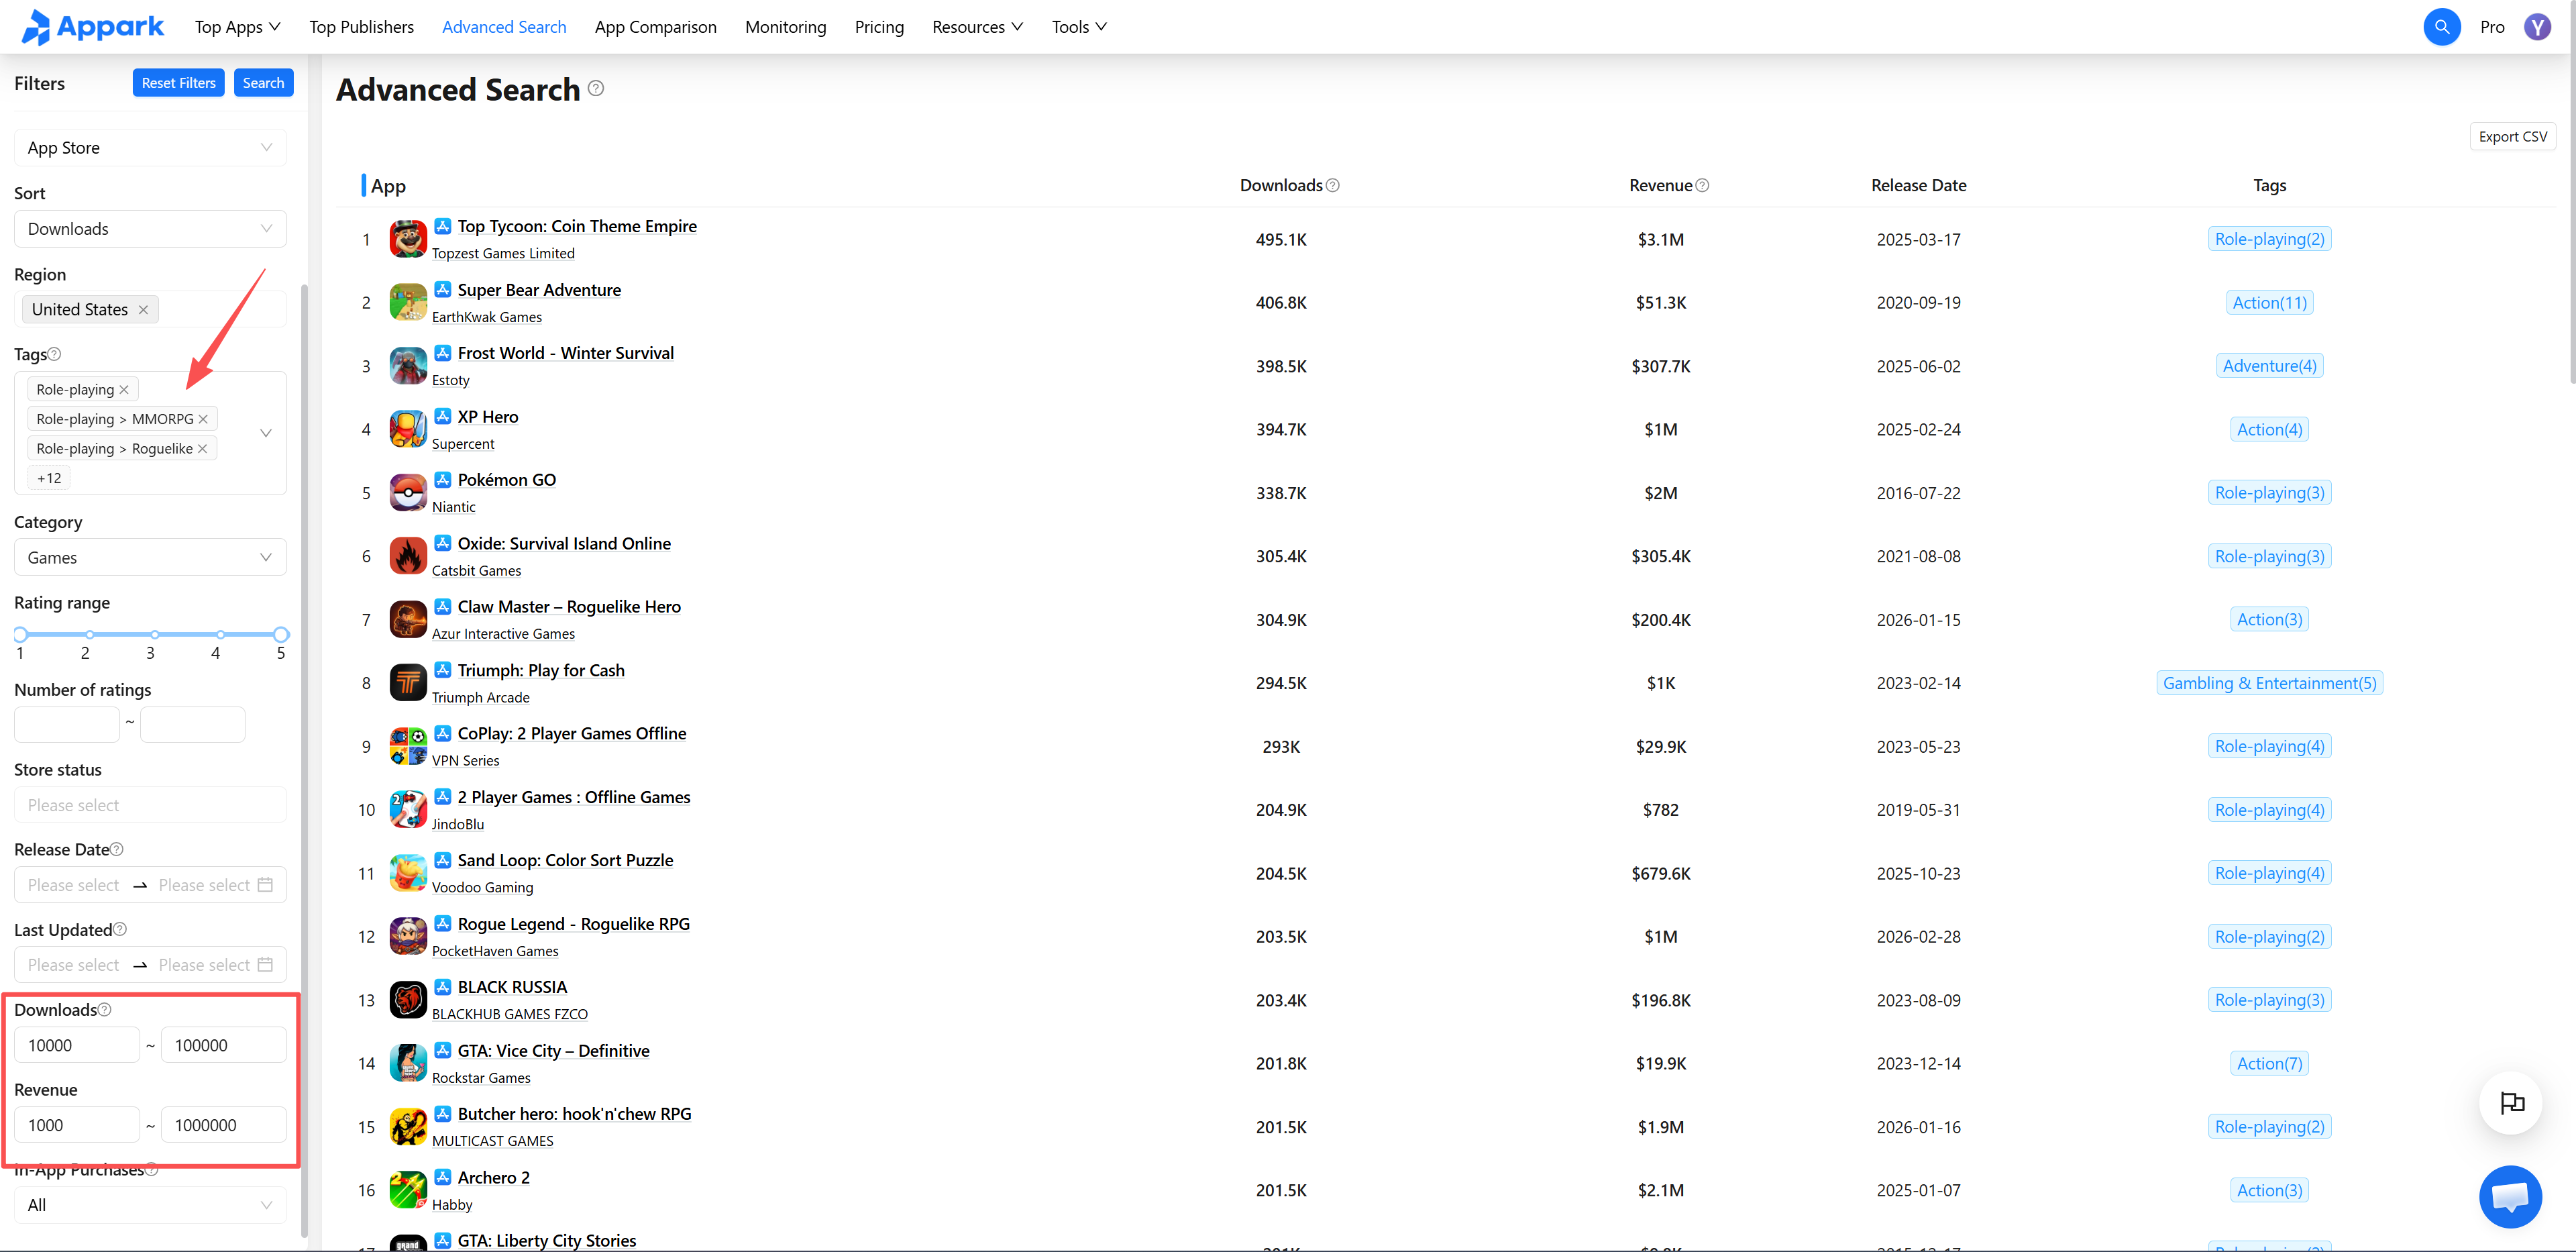
Step 2: Filter for Comparable Products
Use Advanced Search to narrow the dataset by release timeframe, download brackets, and revenue thresholds. This isolates mature, stable titles from recent breakout hits.
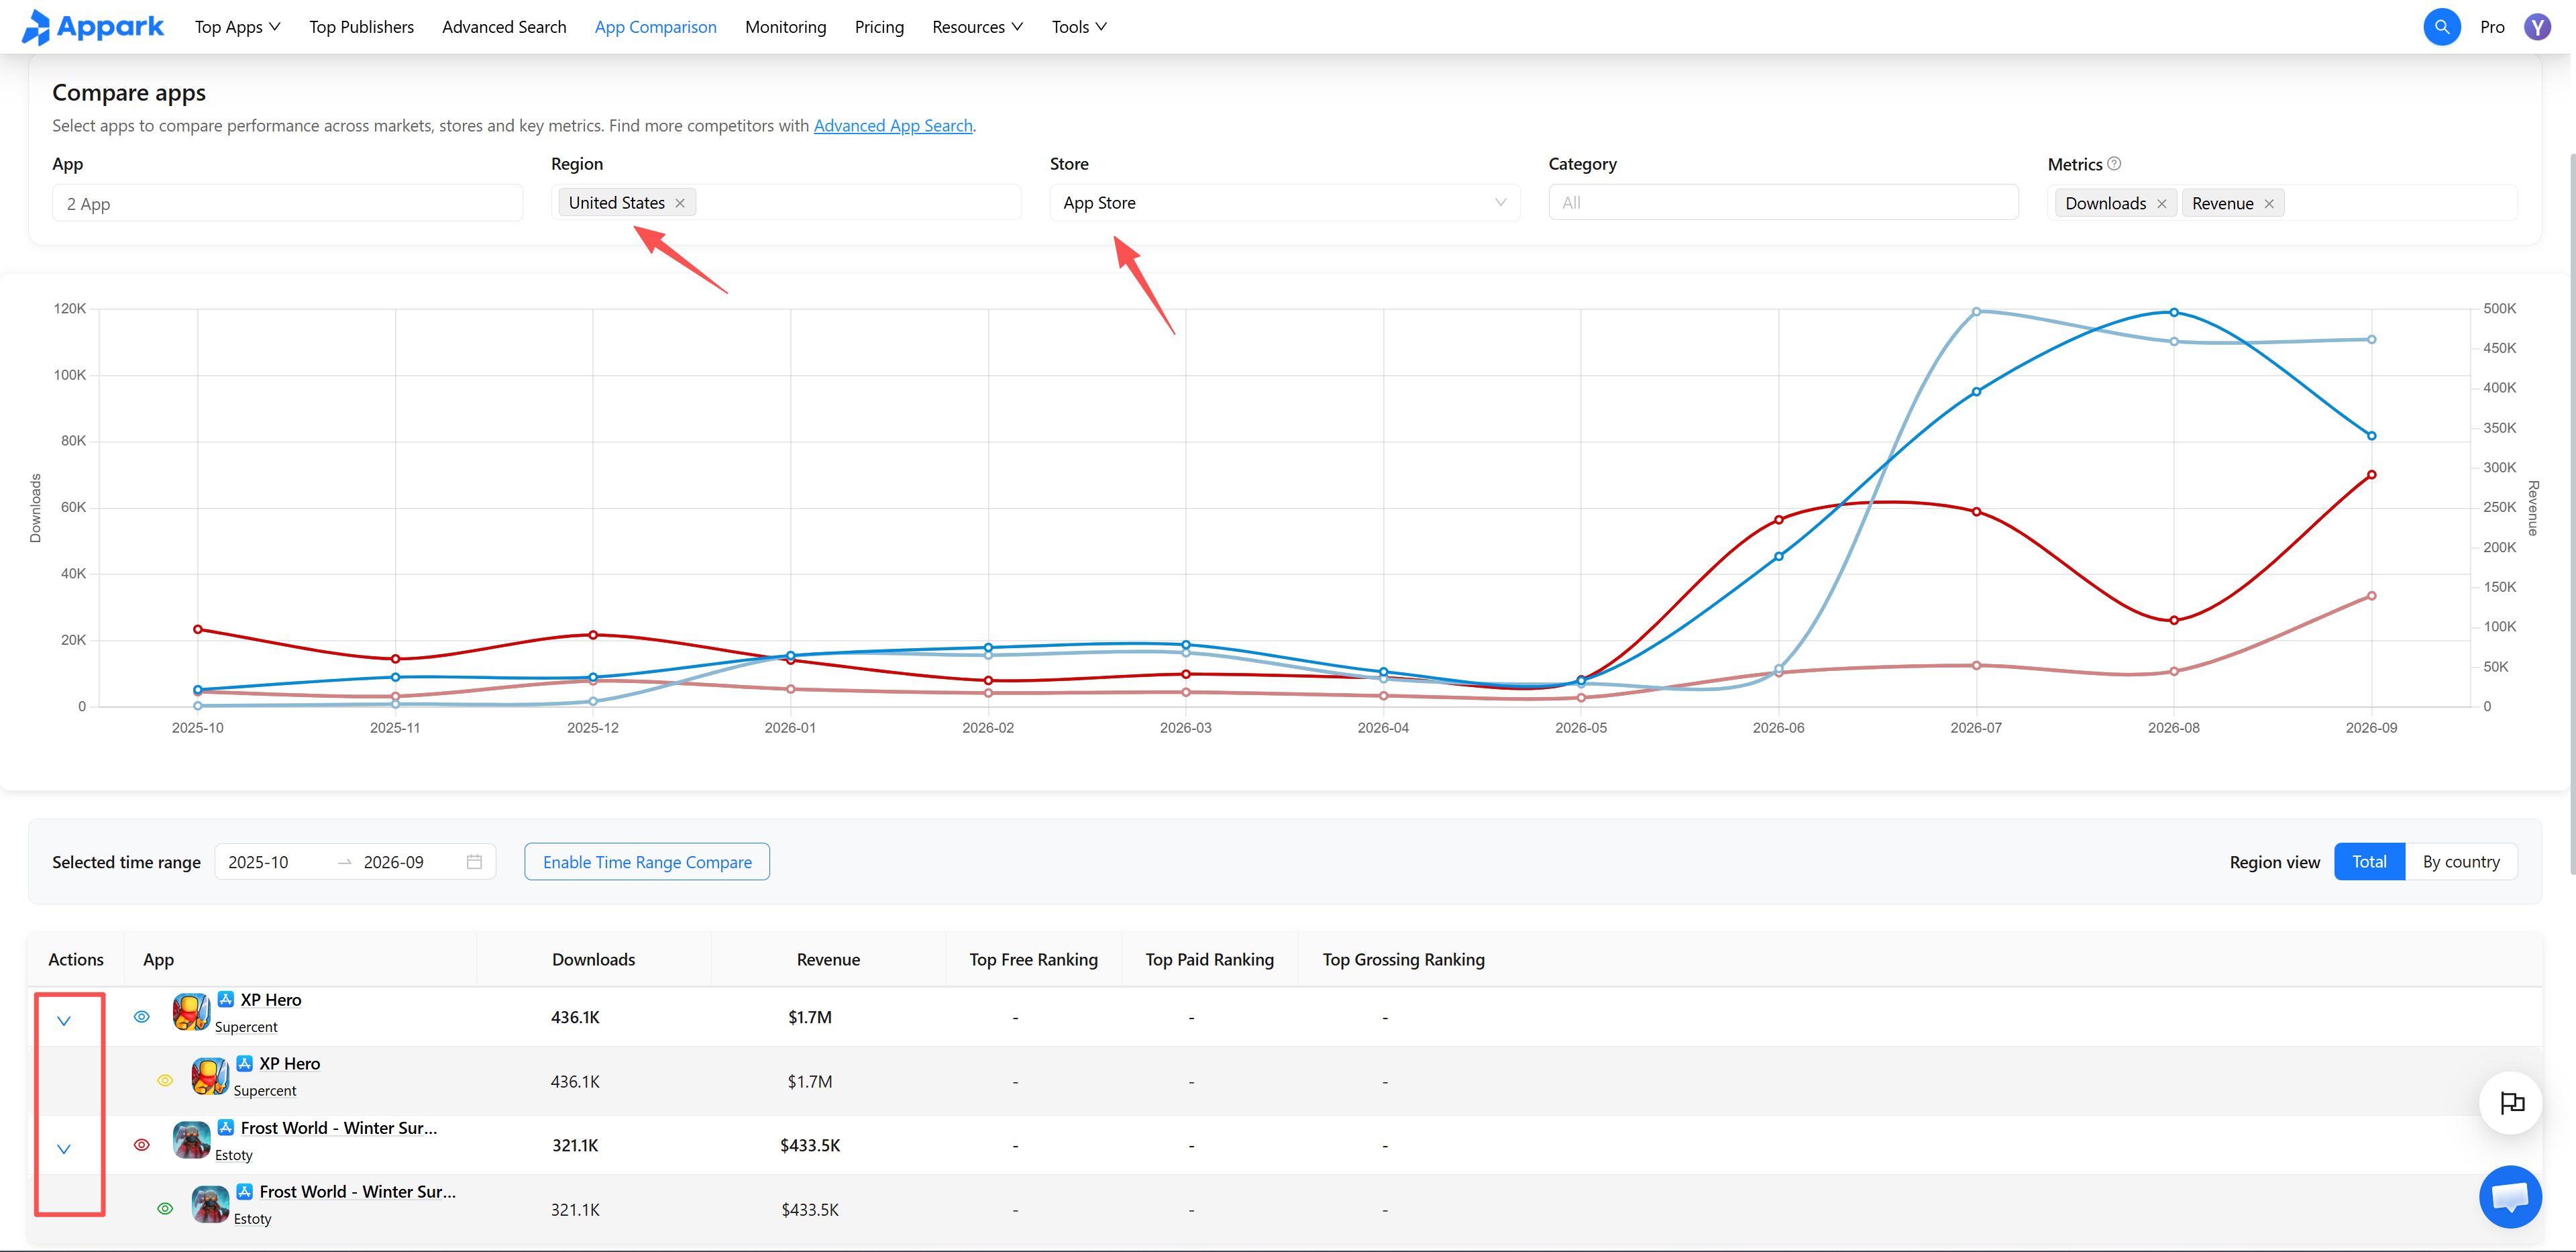
Step 3: Compare Multimonth Revenue and Download Trends
Add 2–3 selected titles to App Comparison. Keep reporting parameters (country, store, and date range) uniform across all selections.
Evaluate estimated store revenue and estimated downloads on separate axes to detect divergence patterns:
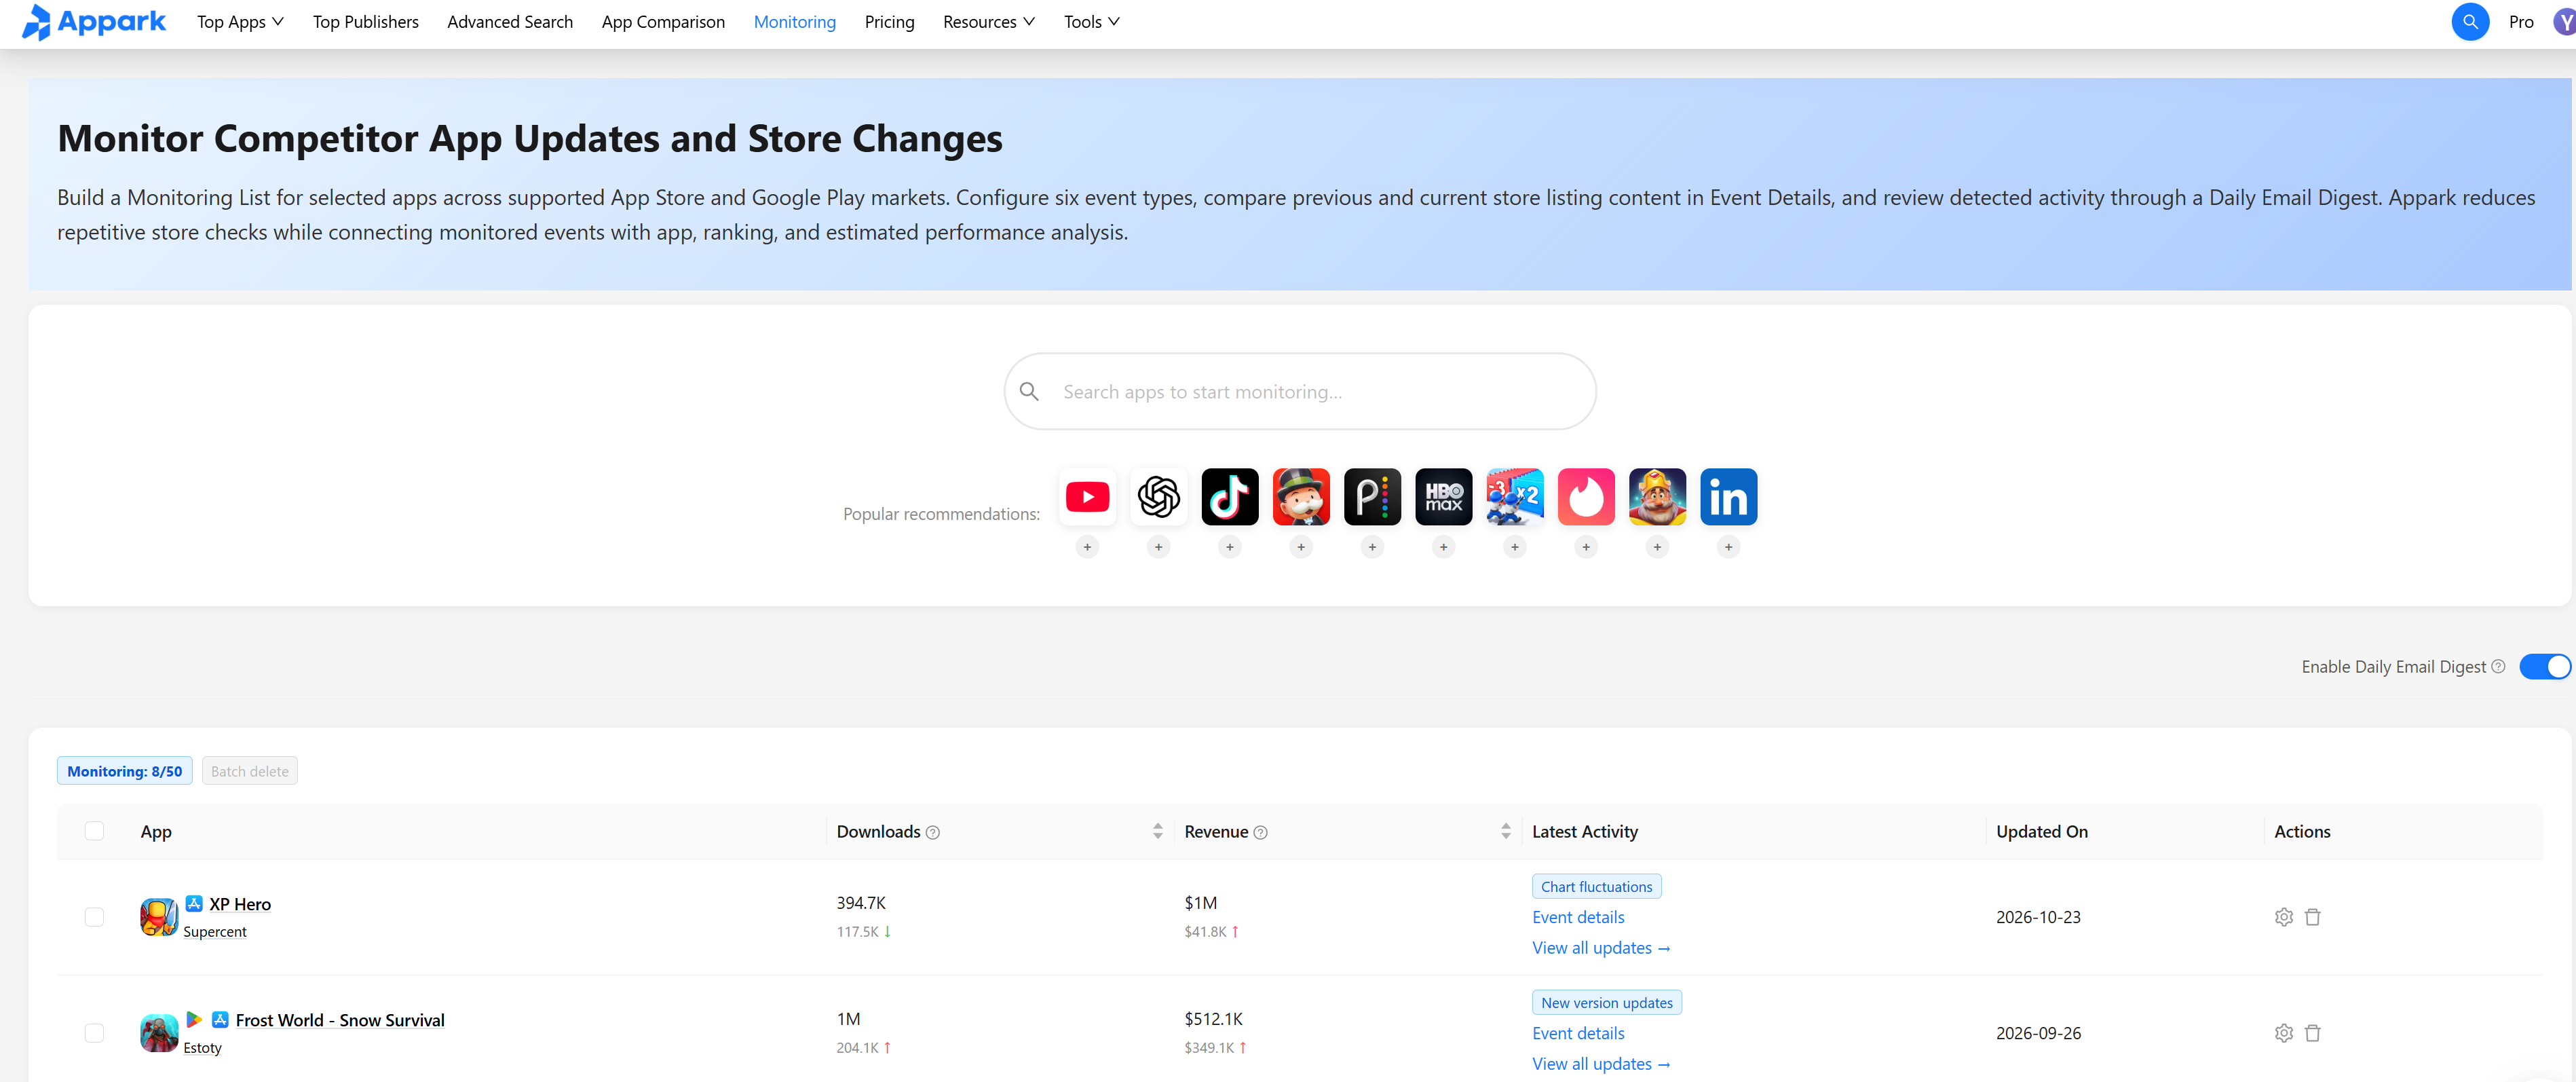
Step 4: Cross-Reference Trends with Release Updates
Track target games in Appark’s Monitoring List to monitor version updates and player rating shifts.
Cross-reference revenue inflections against public release notes and in-game teardowns to confirm what actually changed before drawing conclusions.
Evaluating Monetization Tests: Measuring Net ARPU
When testing a hybrid ad placement or revised event pass, track the net financial impact across all revenue streams alongside player retention.
Consider this illustrative A/B test cohort calculation:
| Metric (Per Player / Observation Period) | Control (Existing Experience) | Variant (New Ad Placement) |
|---|---|---|
| Advertising Revenue (IAA) | $0.40 | $0.55 |
| In-App Purchase Revenue (IAP) | $0.60 | $0.35 |
| Total ARPU | $1.00 | $0.90 (-10%) |
Key Metric Takeaway: While ad earnings rose by $0.15, IAP cannibalization reduced purchase earnings by $0.25—resulting in a net revenue loss of 10%. Always evaluate Total ARPU and long-term cohort retention rather than isolated ad impression gains.
Frequently Asked Questions
Does every game need a hybrid monetization model?
No. Titles with high player purchase conversion and strong natural progression loops often perform better with pure IAP, avoiding ad fatigue entirely. Introduce ads only when non-paying engagement is high and can be monetized without cannibalizing paying cohorts.
Can studios rely entirely on public competitor estimates?
Public app intelligence estimates provide valuable directional and comparative context. However, they do not disclose ad network earnings, external direct-to-consumer web shop sales, or studio infrastructure costs. Treat third-party estimates as an analytical starting point, not audited financial statements.
When should an indie team consider launching a subscription?
Only when your production pipeline can reliably supply continuous, high-value content updates (such as exclusive monthly event tiers, progression perks, or ongoing narrative chapters). Subscriptions churn rapidly if ongoing perceived utility drops after the initial billing cycle.
How are post-ATT privacy restrictions and Google's Privacy Sandbox reshaping ad eCPMs in 2026?
With identifier deprecation reducing deterministic user-level ad targeting, traditional waterfall mediation has largely yielded to real-time in-app bidding coupled with on-device contextual signals. For game teams, this means ad yield now depends heavily on session depth, context-driven placement relevance, and session length rather than purely third-party user tracking. Prioritizing rewarded video over intrusive banners or interstitials helps maintain higher floor eCPMs in privacy-restricted environments.
What is the most reliable way for small studios to measure IAP cannibalization without a dedicated BI team?
Implement simple event telemetry that logs custom client events for every ad watch and store purchase, tagged by user Cohort ID. Run a 50/50 randomized split on new installs. If your tooling lacks automated regression modeling, compare two aggregate metrics across a fixed 14-day observation window: Average Revenue Per Daily Active User (ARPDAU) and D7/D14 Net ARPU (Total IAP + IAA Revenue divided by total cohort users). If the variant's lift in ad revenue is smaller than the loss in IAP ARPU, cannibalization is occurring.
Give Your Next Monetization Change a Clear Purpose
Successful monetization in 2026 is driven by disciplined experimentation rather than blindly copying features from top-grossing charts.
Start with the bottleneck your players are already showing you. Study comparable peers using normalized performance benchmarks, test single variables with clean control groups, and verify that total net player value moves in the right direction.
Ready to Benchmark Your Monetization Strategy?
Don't guess what your competitors are doing behind the scenes. Use Appark to track revenue inflections, download trajectories, and LiveOps version updates across any category or market.